
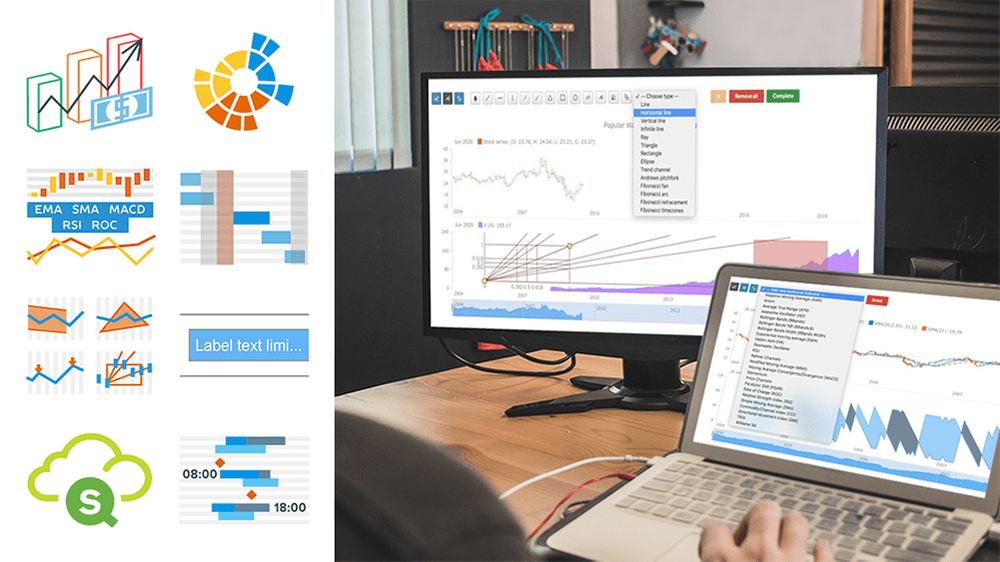
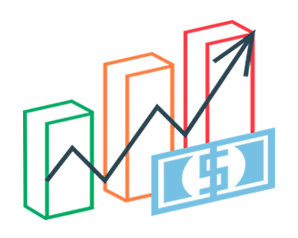
Meet our updated visualization extensions for Qlik Sense! New versions of AnyChart, AnyStock and AnyGantt are now released. The powerful out-of-the-box features we've added will speed up your data analysis, making it even more intuitive and workflows streamlined.
See below to find out what's new.
Technical Indicators Panel
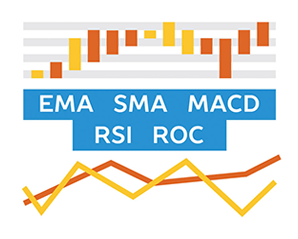
First, we've added a special panel to let you easily add technical indicators while viewing the visualization. So there's no more need to switch to the edit mode to include them! Enjoy greater usability and seamless technical analysis directly where your data is visualized.
In case you missed it, 24 technical indicators were delivered in version 3.4 of the AnyStock extension. They are:
- Adaptive Moving Average (AMA)
- Aroon
- Average True Range (ATR)
- Awesome Oscillator (AO)
- Bollinger Bands (BBands)
- Bollinger Bands %B (BBands B)
- Bollinger Bands Width (BBands Width)
- Commodity Channel Index (CCI)
- Directional Movement Index (DMI)
- Exponential moving average (EMA)
- Heikin-Ashi (HA)
- KDJ
- Keltner Channels
- Modified Moving Average (MMA)
- Moving Average Convergence/Divergence (MACD)
- Momentum
- Price Channels
- Parabolic SAR (PSAR)
- Rate of Change (ROC)
- Relative Strength Index (RSI)
- Simple Moving Average (SMA)
- Stochastic Oscillator
- TRIX
- Williams %R
Drawing Tools Panel
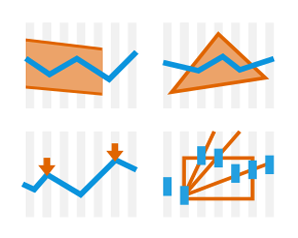
Second, stock overlay drawing tools are now available! You can add more context to your stock charts in one click to ensure quick, intuitive exploration of financial data and accurate forecasts based on the new insights.
The following 14 instruments are currently available in the new Drawing Tools panel in the AnyStock extension:
- Line segment
- Horizontal line
- Vertical line
- Infinite line
- Ray
- Triangle
- Rectangle
- Ellipse
- Trend channel
- Andrew's pitchfork
- Fibonacci fan
- Fibonacci arc
- Fibonacci retracement
- Fibonacci time zones
External EOD Data Panel
Third, we've partnered with reliable third-party data providers to offer you fundamental data, real-time and daily historical stock prices for stocks, ETFs and mutual funds all around the world.
With more than 500 billion data points (and counting) for all major instruments, the feeds track 120,000+ ticker symbols on 60+ stock exchanges globally, as well as 150+ Forex currency pairs and 120+ cryptocurrencies.
Enjoy quick and easy access to any data directly from the dedicated panel in the AnyStock extension to further streamline your financial and stock data analysis.
Sunburst Chart

Fourth, meet a new arrival in the list of the chart types available in the AnyChart extension for Qlik Sense. A Sunburst Chart is ready for use!
Also known as Ring Charts, Multi-level Pie Charts and Radial Treemaps, Sunburst Charts are frequently employed in hierarchical data analysis. Such a visualization depicts each level of the hierarchy in the form of a ring, with the top level represented as the innermost circle.
Explore and drill down into your hierarchical data in a straight-to-the-point Sunburst Chart visualization with the same native Qlik Sense experience!
Weekends and Holidays Coloring
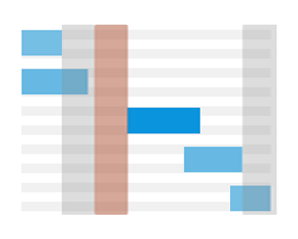
Fifth, the AnyGantt extension now provides the option to change how weekends and holidays are colored on the timeline of a Gantt chart.
Leverage the new capability to improve what can be seen at a glance in the visualizations of your plans and schedules, all for more intuitive project management!
Labels Text Length
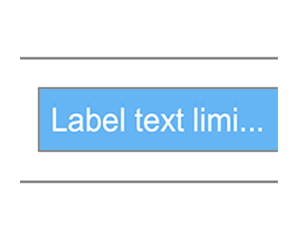
Sixth, now you can limit the number of characters in Gantt chart labels using the AnyGantt extension in just a couple of clicks.
Benefit from easier control over the way labels are shown in your Gantt charts!
Left and Right Gaps
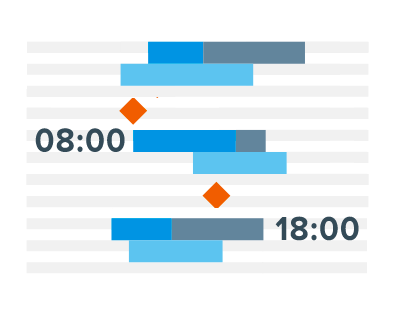
Seventh, we've added the option to add gaps, left and right, on the Gantt chart timeline.
Give this new feature a try in the latest version of the AnyGantt extension and enjoy enhanced display and print output!
Qlik Sense Cloud Version Support

Last but far from least, our AnyChart and AnyStock extensions are now available in cloud editions of Qlik Sense, ensuring the same powerful data visualization experience as in Qlik Sense Desktop and Qlik Sense Server.
AnyGantt is already there, too! Feel free to make good use of our advanced charting tools to create rich visual data analytics in Qlik's secure cloud environment.
Download and Share Feedback
Download the latest version of our AnyChart, AnyStock and AnyGantt extensions to see what they can do for you and your customers with these new features in action.
Or schedule a demo and one of us will be happy to provide a guided tour of our products, helping to build a proof of concept application with your data.
Is there anything else you would like to get in our Qlik Sense extensions? We always carefully listen to our community, so please share your ideas and we will do our best to implement them in a timely manner.