
Listening to our community is foundational to our development efforts. In response to feedback from some of our customers, we've just added new features to the Decomposition Tree extension for Qlik Sense, aimed at enriching data insights. Here’s a quick overview.
New Decomposition Tree Features
1. Secondary Measure on Display
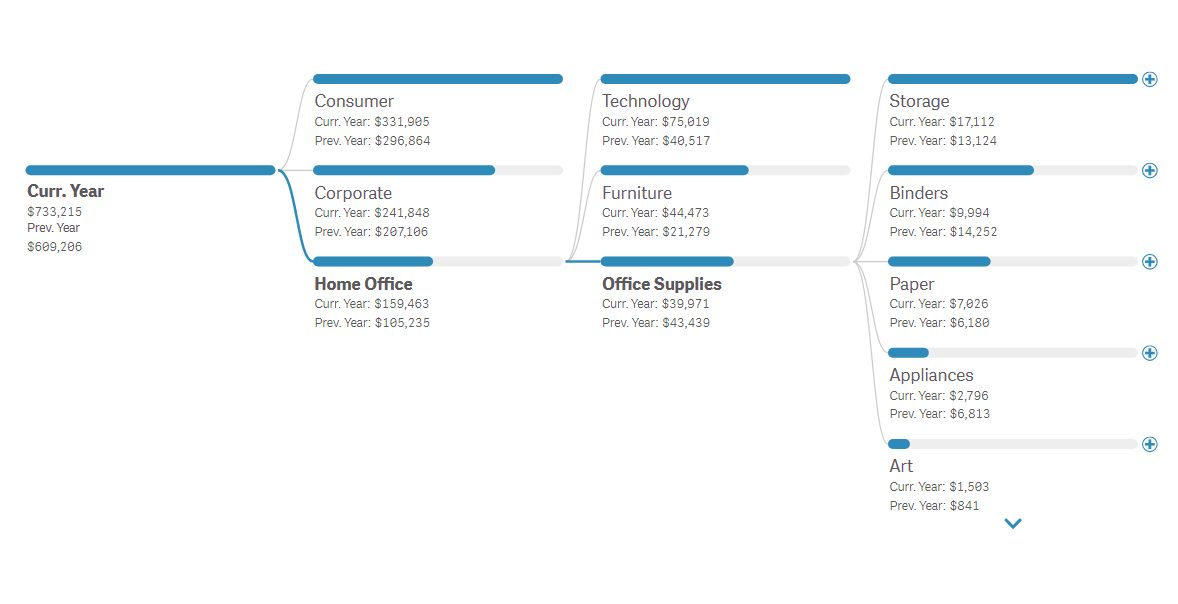
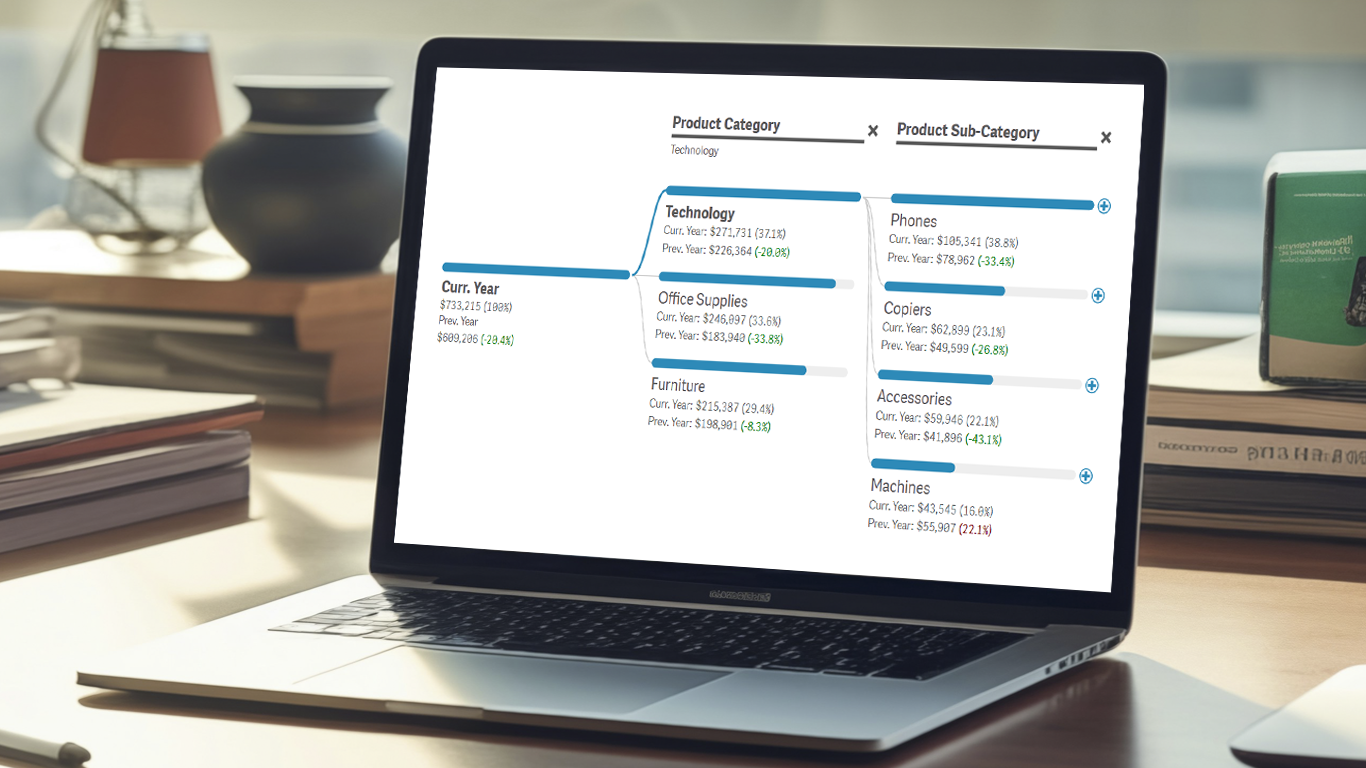
Last fall marked the beginning of our journey to integrate multiple measures within a single Decomposition Tree, as we made it possible to add alternative measures, with effortless switching via a dropdown on the root element. Expanding upon this, we've now introduced the option to display an additional measure right next to the primary one.
In this setup, the secondary measure is conveyed through a dedicated row of labels, bringing added context and side-by-side exploration to the table. Users can switch both measures to their alternatives as they analyze.
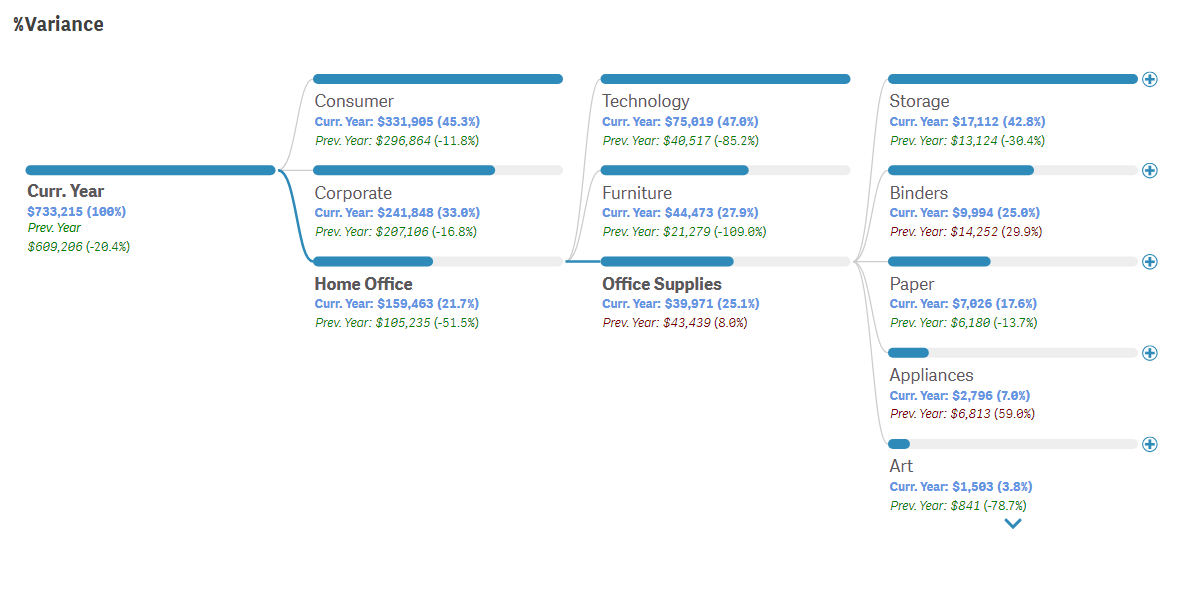
2. Contribution and Variance
To further enhance the analytical capabilities of the Decomposition Tree, we're introducing advanced calculations for display in measure labels alongside elements: Contribution and Variance. Overcoming the limitations of Qlik's native expressions, we've developed a proprietary algorithm to efficiently implement this functionality.
Percentage Contribution
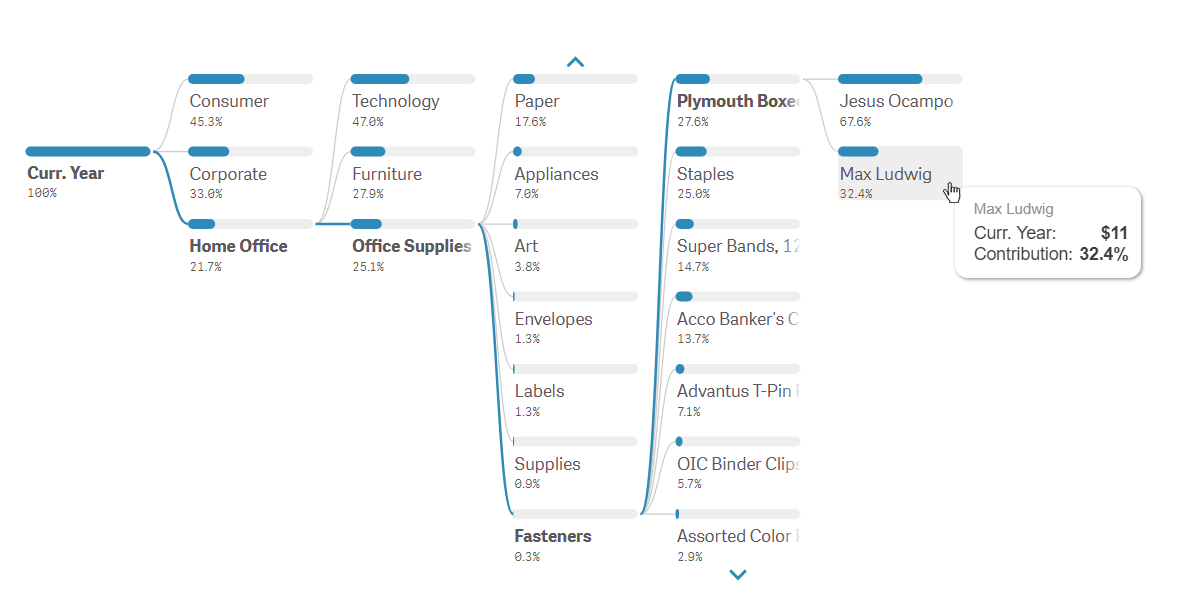
Now, the primary measure can display each element's percentage contribution to the root or parent element, offering a clear depiction of its impact across the hierarchy. This feature is available both when the measure is shown on its own and when it appears with a secondary measure.
Variance Analysis
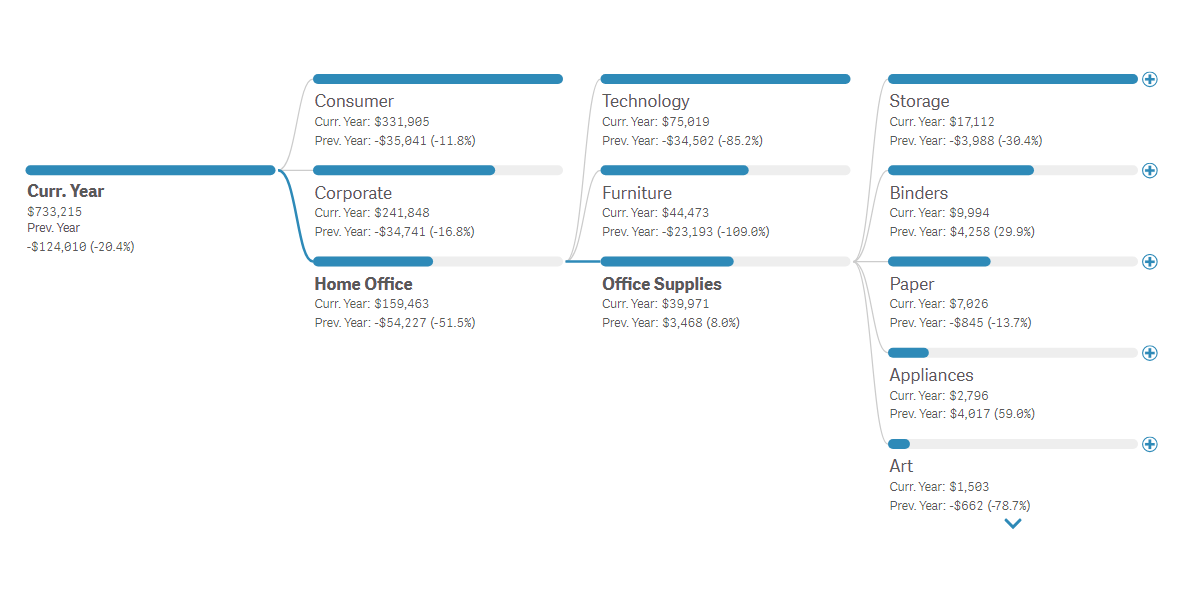
The secondary measure can display its variance from the primary measure as either an absolute value, percentage, or both, streamlining comparisons between similar metrics, such as the current year versus the previous one.
3. Flexible Measure Labels
To complement the newly introduced features, we've integrated options to customize measure label rows for specific analytical and presentation needs.
- Display Templates: Flexibility is at your fingertips with the ability to choose which details are shown about each measure. Whether you opt for displaying only its value, name, contribution or variance, or any mix of these, the choice is yours.
- Font Customization: Expanding our personalization options, you can now adjust the font of measure labels to ensure the visual presentation aligns with your branding or stylistic preferences.
What Else?
Beyond these headliners, our latest release also brings enhancements across our suite of Extensions for Qlik Sense. Notably, the Combo Chart and Waterfall Advance extensions have received a series of improvements and bug fixes to improve their performance and functionality.
Download and Share Feedback
We invite you to download the updated extensions and see the new capabilities firsthand. Your feedback is crucial — it fuels our continuous improvement and helps ensure our tools meet your needs effectively. If you have any comments, suggestions for new features, or need support, we'd love to hear from you.