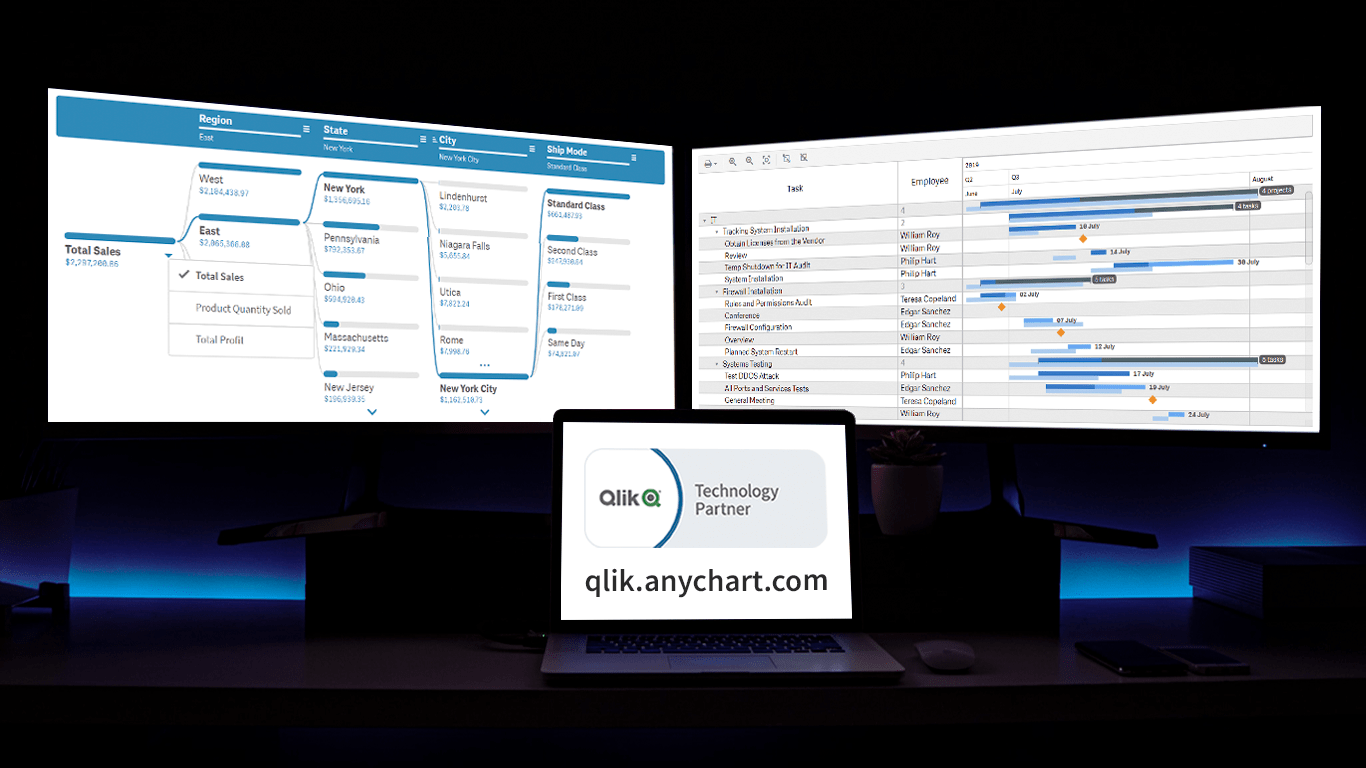
Prepare for an advanced level of data control and customization as we unveil the latest update for our Qlik Sense extensions! The September 2023 release is dedicated to enhancing your visual analytics experience, with a particular emphasis on the Decomposition Tree and Gantt Chart visuals. So, without delay, let's delve into what's new:
Decomposition Tree: Unleashing Your Data's Potential
Multiple Measures: More Power at Your Fingertips
Say hello to the newfound capability of working with multiple measures within the same decomposition tree! No more starting from scratch when you want to explore different metrics. Now, you can set alternative measures alongside your primary one, enabling seamless switching in Analyze mode.
Getting started is a breeze — simply add alternative measures in the Data tab of the properties panel in Edit mode. When it's time to analyze, click the root total element to select your metric of choice.
Column Sorting: Streamlined Data Organization
In our commitment to improving your data analysis experience, we've added a nifty feature to sort elements within dimension columns in Analyze mode. This facilitates organizing elements by value within columns while you explore, making it easier to spot patterns and trends.
Just click the three dashes in a column's header and select your desired sorting order: ascending, descending, or revert to the default order defined in the Sorting section of the properties panel in Edit mode, which can be alphabetical or expression-based.
Header Customization: Your Style, Your Way
We understand the importance of personalization. That's why we've implemented the ability to customize the appearance of dimension column headers. You can now easily tailor the visual elements of headers to match your preferred style or align with your organization's branding.
Explore these options in Appearance -> Header Settings, where you'll find all available customization choices, including font styles, background colors, and more.
Gantt Chart: Enhanced Data Control
Customizable Data Loading: Tailoring Your Experience
We're excited to introduce advanced data loading control within Gantt charts, applicable to both Project and Resource visualizations. You can now fine-tune the row retrieval behavior by specifying the data chunk size, achieving the optimal equilibrium between loading speed and seamless scrolling, all based on your preferences.
The default chunk size retrieves 50 rows per request, ensuring a balanced performance. Customize this setting in Add-Ons -> Data Handling -> Data Chunk, allowing you to select any value between 1 (incremental row-by-row loading) and 10000 (comprehensive initial rendering).
More Improvements: Smoother Experience
We've also made several other important improvements and fixed bugs to ensure a smoother user experience and deeper personalization. Notable enhancements include, for example, an array of general styling options to customize your Decomposition Tree, Combo Chart, and Circular Gauge visualizations, encompassing background color and image, title, subtitle, and footnote texts, enabling you to easily align your data presentation with your design vision.
For a complete list of new features, improvements, and bug fixes, see the release notes:
Expecting Your Feedback
We're all about empowering you with the tools you need to make the most of your data. We hope these updates further streamline your data analysis process and elevate your user experience.
As always, your feedback is incredibly valuable to us. If you have any questions, need assistance with the latest arrivals, or want to suggest a new feature, please don't hesitate to reach out to our Support Team. And let's meet in person at QlikWorld Tour next week in NYC or Atlanta if you will be there too!
Enjoy exploring your data using Qlik Sense with AnyChart's extensions!