
Hey there! We have some exciting news to share with you today. AnyChart's Qlik Sense Extensions have undergone a major update as we've made improvements across all of them, including the Decomposition Tree. However, we are particularly thrilled to announce the addition of some major features to our Sunburst Chart and Gantt Chart extensions.
But wait, there's more! If you're attending QlikWorld these days, we invite you to visit our team in Booth #180. There, you can try out the new features in action, ask questions, and learn more about how our extensions can improve your visual analytics experience in Qlik Sense. Don't miss out on this chance to experience the AnyChart difference first-hand!
Our team has been hard at work, listening to your feedback and making improvements. We are confident that these new features will give you greater creative control and better performance in your Qlik-powered environment. So without further ado, let's dive into the details of the major new upgrades!
Sunburst Chart Extension
"Other" Data Grouping
We've improved data handling for displaying a large number of points, and now less significant points can be grouped into an "Other" category using two algorithms — by value and by angle. This streamlines complex visualizations, making them easier to read and understand. You can access this feature under "Data handling" > "Grouping."
Optimized Display Of Levels
Our latest update brings an optimized display of levels (dimensions) on the chart. You can now control the number of visible levels and adjust the pixel width of the radius for other levels, resulting in a more visually pleasing and informative appearance. You'll find this feature under "Appearance" > "Levels." Additionally, null values in the data set are no longer shown on the chart for a cleaner presentation.
Customizable Stroke
Add more personalization to your charts with our new customizable stroke feature. Feel free to adjust the color, thickness, and opacity of the stroke of graph elements, getting greater creative control over your visualizations. Simply navigate to "Appearance" > "Colors" > "Stroke" to access the stroke settings.
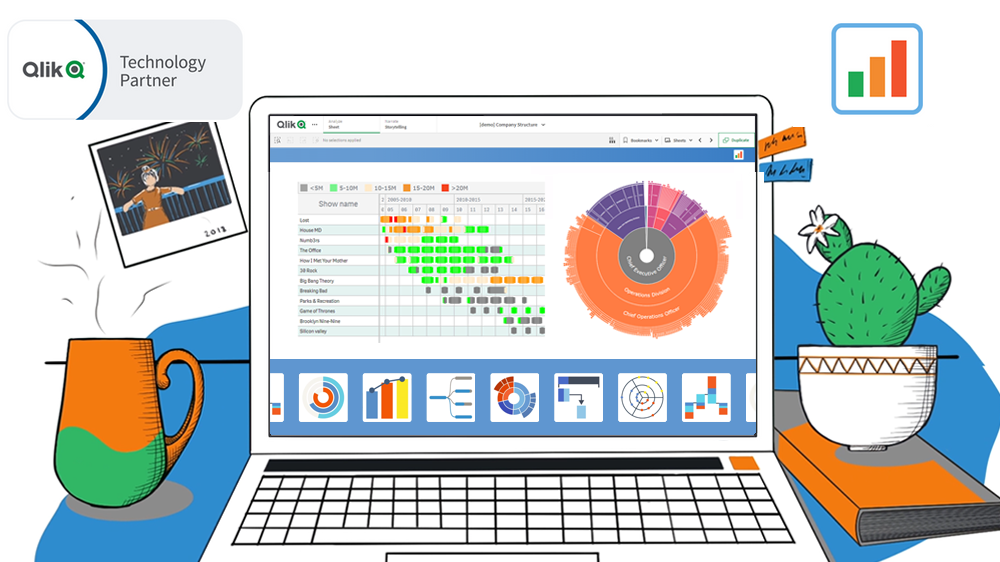
Check out our new Qlik Sense demo app showcasing the updated Sunburst Chart extension in action:
➡️ Company Structure — Uses a sunburst chart to visualize a company's organizational hierarchy, including over 800 subdivisions across 12 levels.
Gantt Chart Extension
Smart Data Loading
We've revamped data handling so that data now loads partially and only when it's needed. This results in faster load times and a more responsive user interface. We've also added a "Loading data" message so you know what's going on while you wait.
Faster Chart Rendering
We've overhauled the rendering mechanism to ensure that chart rendering speed is no longer affected by a large volume of data. You'll notice a dramatic increase in drawing speed!
Optimized Expression Performance
We've resolved an issue related to expressions that previously caused unnecessary redraws, which used to slow everything down. With this improvement, expressions are optimized for better performance, and you can manipulate data faster and more efficiently.
Enhanced Printing Capabilities
We've fixed a bug that caused missing labels on Gantt charts when printing through the toolbar. So now you can print your Gantt charts accurately without any issues.
Check out our new Qlik Sense demo app showcasing the updated Gantt Chart extension in action:
➡️ TV Shows — Uses Gantt charts with multiple milestones to visualize TV show popularity.
More Improvements Across All Extensions
And that's not all! We've put on our bug-fixing and improvement hats to make sure all extensions, including the Decomposition Tree, are functioning better than ever!
Check out our new Qlik Sense demo app showcasing some of the updated major extensions in action:
➡️ AnyChart Complex Demo — Features Decomposition Tree, Gantt Chart, Combo Chart, Circular Gauge, Bullseye Chart, Sunburst Chart, Timeline Chart, and Waterfall & Advanced Waterfall Chart visualizations.
We hope you enjoy these new features and improvements, and we're always eager to hear your feedback. So don't hesitate to reach out with any comments or suggestions. And don't forget to stop by booth 180 at QlikWorld to meet our team and try out the new features! Thanks for being a part of the AnyChart community!
ICYMI: We partnered with Qlik to bring new data visualization choices to the Qlik platform via intuitive extensions for Qlik Sense. Give them a try — download, see demo apps, or book a live demo session.