2023 was remarkable! Join us as we bid farewell to the year by reflecting on its best moments for AnyChart in the Qlik ecosystem. At the heart of it all was our 20th anniversary — indeed, we've been innovating since 2003. And last year, new recognition came our way as we were awarded the best in data analytics and visualization.
Throughout 2023, we consistently raised the bar by launching new extensions and elevating our established solutions. Noteworthy moments included making waves at QlikWorld in Vegas with our Decomposition Tree and unveiling the AI-driven YODA — Your Own Documents Assistant during QlikWorld Tour.
Let's take a look back at the pivotal highlights that shaped our 2023!
New Qlik Sense Extensions
At the dawn of the year, we expanded the Qlik Sense ecosystem with three brand new extensions, designed to improve your visual data analytics in Qlik:
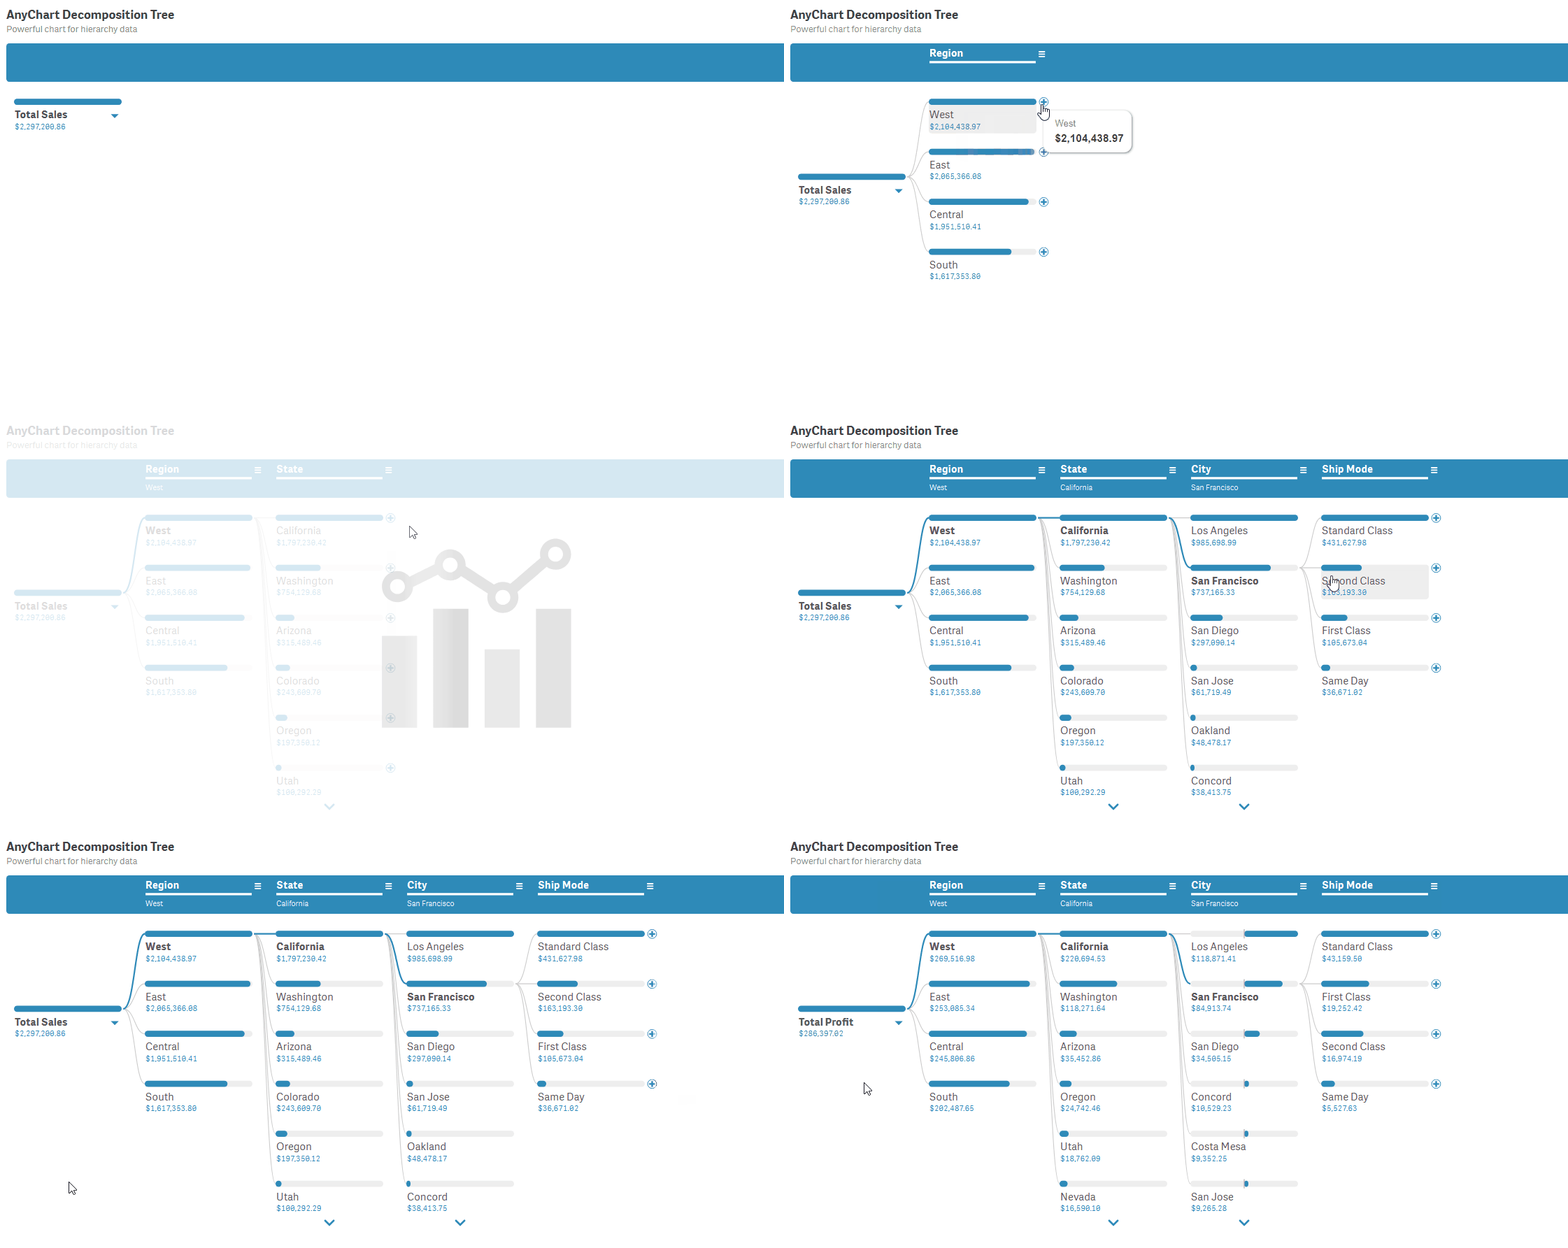
Decomposition Tree
Reimagine data exploration with this game-changer tool that never existed in Qlik Sense before, allowing dynamic breakdowns across multiple dimensions for seamless ad-hoc exploration and root cause analysis.

Learn more | Download | Explore features in demo app | See tutorial
Combo Chart
Dive deep into intricate data relationships, featuring capabilities like stacked bars, nested axes, crosshairs, error bars, multiple series types, and more — taking your combo charts beyond Qlik's native implementation.

Learn more | Download | Explore features in demo app
Circular Gauge
Gain the ultimate freedom in visualizing your KPIs, as now you can make a gauge of any shape, add multiple pointers, tailor the look and size to your dashboard's needs, add images, texts, and more — going way further than what used to be standard in Qlik Sense.

Learn more | Download | Explore features in demo app
YODA — Your Own Documents Assistant
In the warm embrace of summer 2023, we ventured into uncharted territories with the private beta release of YODA. This avant-garde AI assistant extracts profound insights from your documents through intuitive natural language interactions right there in your own Qlik environment.

Learn more | Join private beta — schedule demo
New Features in Our Classic Extensions
Listening to our community's valuable feedback, we enriched our classic extensions with a bunch of new features. Below are some of the major highlights:
Gantt Chart

- Baseline-dependent coloring of actual bars
- Baseline milestones
- Customizable data loading
- Accelerated chart rendering
- Optimized expression performance
- Improved printing capabilities
Sunburst Chart

- "Other" data grouping
- Optimized display of levels
- Customizable stroke
New Demo Apps

In our continuous effort to demonstrate the capabilities of our extensions in Qlik Sense, we built a series of new demo apps. These showcase how you can unlock the full potential of your data using our latest charts and features. Here are the key public demos from this year:
- Tech Layoffs – highlighting the Decomposition Tree
- Company Structure – showcasing the Sunburst Chart
- U.S. Climate – utilizing the Combo Chart
- Popularity of TV Shows – demonstrating the Gantt Chart
- AnyChart Complex Demo – a comprehensive demo featuring a range of our charts
New Exposure
Our global footprint expanded with participation in multiple trade shows. QlikWorld 2023 in Las Vegas, of which we were a Sapphire sponsor, was a highlight. The Decomposition Tree extension took center stage, garnering especially a lot of attention.
was literally "standing room only" at the @AnyChart booth all of Day #1 here at #QlikWorld 2023 in Las Vegas.. I listened in on a few of the demos - some amazing solutions can be done with ease with @Qlik + #AnyChart - put your big challenges to them, and be ready to be wowed ;-) pic.twitter.com/MFWrAkHs1x
— Dez Blanchfield ( sociaall.com ) (@dez_blanchfield) April 19, 2023
The event culminated in a truly memorable evening at Allegiant Stadium.

Dive into our QlikWorld 2023 recap with more photos
At the subsequent QlikWorld Tour roadshow, we visited Dallas, San Francisco, New York City, and Atlanta. A fresh star of the show was our newly developed YODA.

New Recognition
Winning the DEVIES 2023 Award for Best in Data Analytics & Visualization, marked another pivotal moment for AnyChart, reaffirming our dedication to technological excellence. The award specifically recognizes our foundational JavaScript charting library, the backbone of all our extensions for Qlik Sense.

The ceremony, held in California, represented one more exciting milestone in our 20th-anniversary year.

Final Reflections
For us at AnyChart, 2023 was a year of innovation, growth, and community. As we look ahead, our dedication remains unwavering: to empower your data viz and analytics journey with new and better tools.
Thank you for growing with us, and cheers to your continued success, brighter and bolder in 2024!
