Ever feel overwhelmed by complex datasets, endless sheets, and constant requests from business users?
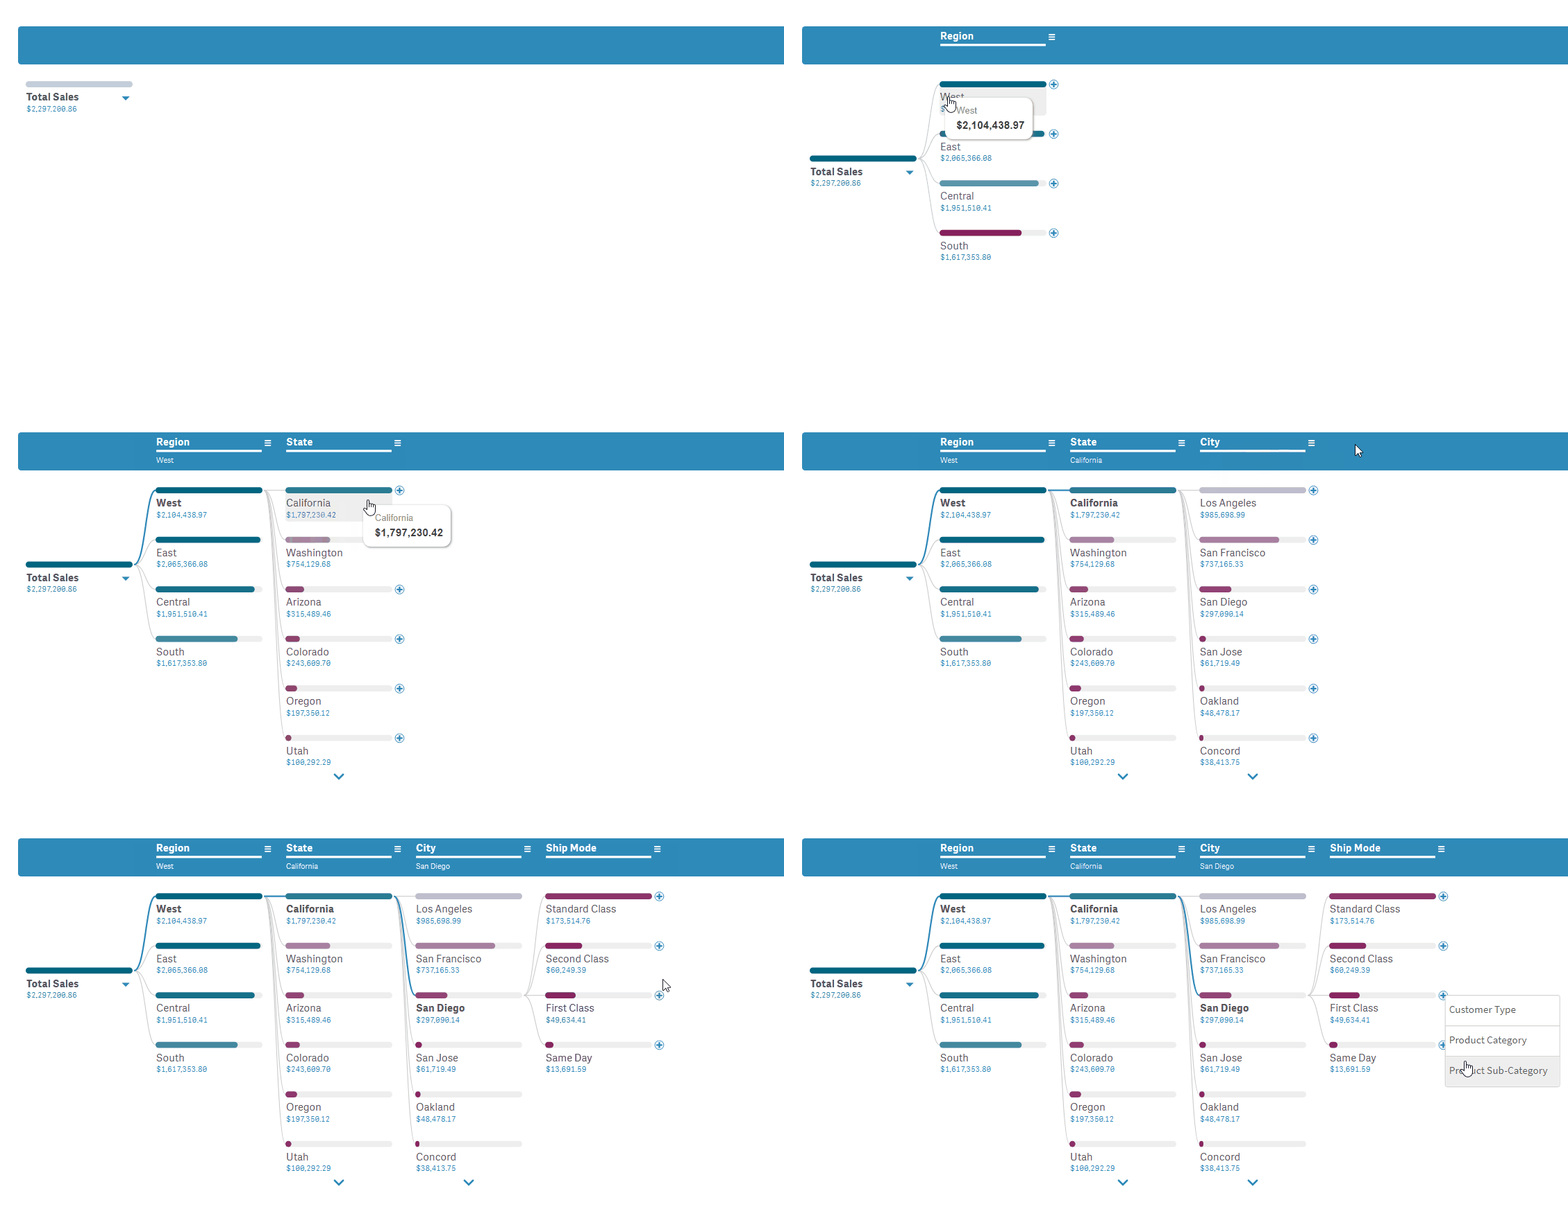
The solution is here — join our exclusive webinar on February 8th and meet the Decomposition Tree, a new rockstar chart in Qlik Sense that's worth a dozen! Enabling users to slice and dice metrics as they please, this game-changing visualization unlocks root cause analysis and ad-hoc exploration of complex datasets on the spot.
Key takeaway — you'll become a master at crafting smaller, yet more impactful dashboards that even non-techies can navigate intuitively. And while they explore and make decisions, just kick back, take a sip, and enjoy life.

Act now! Register for the webinar — it's free, but slots are limited. Don't miss the chance to elevate your data mastery and earn your business users' love for revolutionizing their data analysis journey!
- Americas:
Feb. 8, 2024 — 2:00 PM EST — register here - Europe, Middle East & Africa:
Feb. 8, 2024 — 11:00 AM CET — register here
