
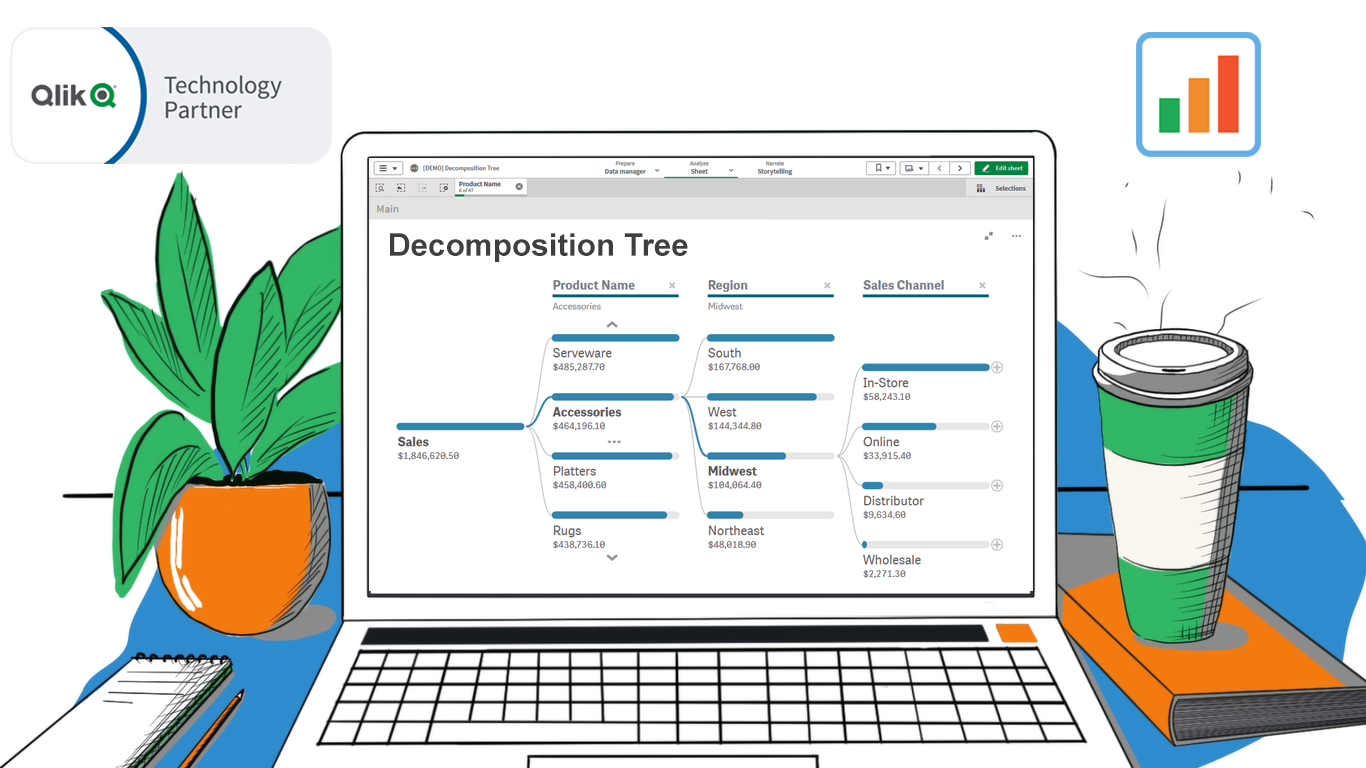
Happy day, data analysts using Qlik! We are thrilled to announce the release of our groundbreaking Decomposition Tree extension for Qlik Sense!
Previously unavailable in Qlik natively or in a third-party extension, a decomposition tree is an incredibly powerful technique. It lets you intuitively explore your core metrics across a number of dimensions. So you can quickly see which factors affect the totals and make timely decisions to optimize business performance and profits.
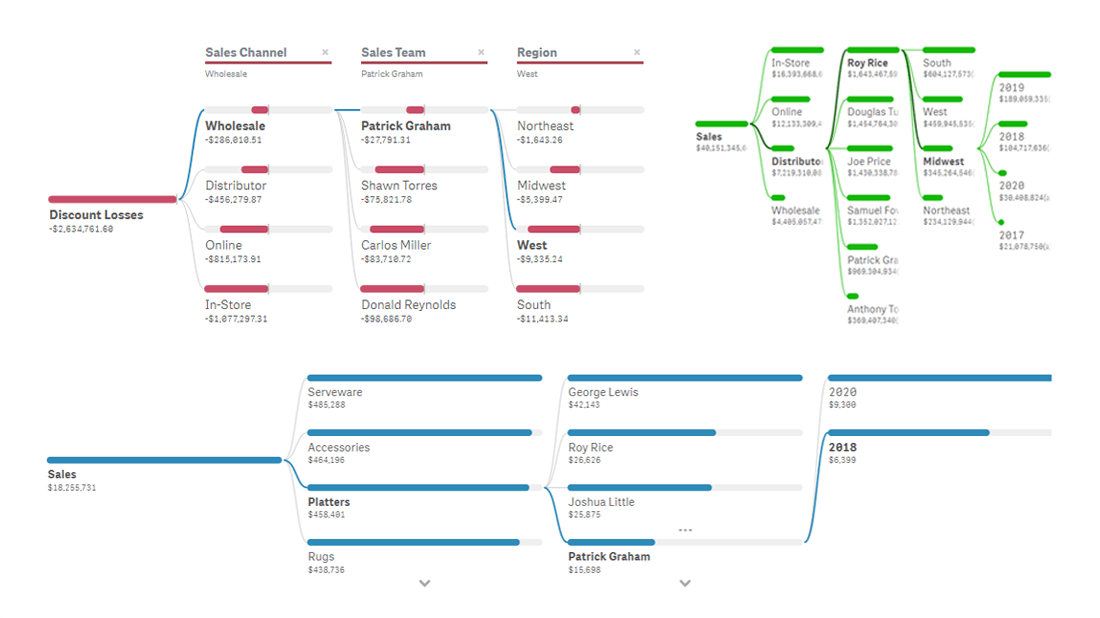
Our decomposition tree allows true ad hoc reporting across multiple dimensions, enabling root cause analysis! Simply choose the measure you want to analyze. The chart will automatically disaggregate it and display how the value breaks down.
With the option to change the order of dimensions to drill down into, you can slice and dice a metric in a report on the fly. Feel free to use conditional coloring to boost at-a-glance insights. Multiple view modes will allow seamless integration into your dashboards.
Check out two free Qlik Sense demo apps showcasing the decomposition tree extension in action:
➡️ Decomposition Tree Features — presents all major features of AnyChart’s decomposition tree.
➡️ IMDb Top 1000 Movies — lets you dig into the top 1000 movies of all time according to IMDb with the help of a decomposition tree.
Excited to offer you this unique opportunity, we hope it helps you get the most out of your visual data analytics. Get the extension today and start analyzing your data like never before:
➡️ Download Decomposition Tree Extension
In addition to the decomposition tree, we have just released two other unique visualizations for Qlik Sense — Deluxe Combo Chart and Versatile Circular Gauge — and new Gantt chart features. Check them out too, ask us questions if any, and let us know if you lack anything else in Qlik Sense!
ICYMI: We partnered with Qlik to bring new data visualization choices to the Qlik platform via intuitive extensions for Qlik Sense. Give them a try — download, see demo apps, or book a live demo session.