

Hey Qlikkies, are you itching to explore your data ad-hoc across multiple dimensions and conduct root cause analysis like a boss? Look no further than the Decomposition Tree visualization! I first stumbled upon this gem in Power BI, but guess what? Now you can harness its power within the realms of the Qlik Analytics Platform. In this tutorial, I'll demonstrate how you can easily create amazing decomposition trees for your BI dashboards and apps in Qlik Sense.
A decomposition tree is a type of chart that uses a tree-like structure to represent how a whole metric or outcome can be broken down into its constituent parts or factors. It provides a hierarchical view of the relationships between different dimensions or variables and their contributions to the overall metric. By visually displaying the decomposition of a measure, such as sales or revenue, into various components, such as product categories, regions, or time periods, the decomposition tree helps identify the key drivers and understand the underlying factors influencing the metric. And I’ll use the tech layoffs data to show you how this can look and work in reality.
Let's dive in and unleash the decomposition tree power in Qlik Sense!
Creating Decomposition Tree in Qlik Sense
Qlik doesn't support decomposition trees out of the box. The only way to build them is by using the Decomposition Tree extension for Qlik Sense developed by Qlik's technology partner, AnyChart. Thankfully, with this extension, the entire process becomes as easy as one-two-three-four:
- Download and install the extension
- Set up an app
- Add the extension
- Add a measure and dimensions
I will walk you through each of these four steps right now.
1. Download and install the extension
First of all, go to the AnyChart website and download the Decomposition Tree extension for Qlik Sense.

If you’re using Qlik Sense Desktop, after downloading the archive, extract its contents and place the anychart-4x-decomposition-tree folder in the directory:
..\Users\<UserName>\Documents\Qlik\Sense\Extensions
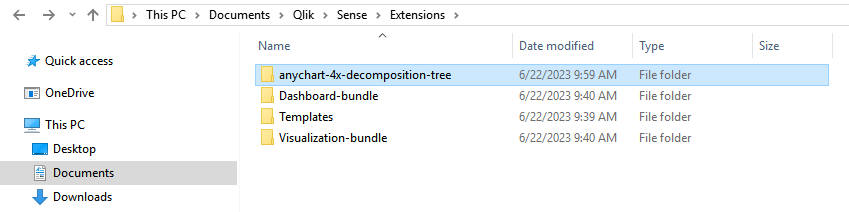
Relaunch Qlik Sense Desktop if it is already open.
(If you’re using Qlik Sense Server or Qlik Sense Cloud, follow the instructions here for the installation process specific to your environment.)
2. Set up an app
If you already have an app and a sheet ready, skip this step and proceed directly to the 3rd step right away.
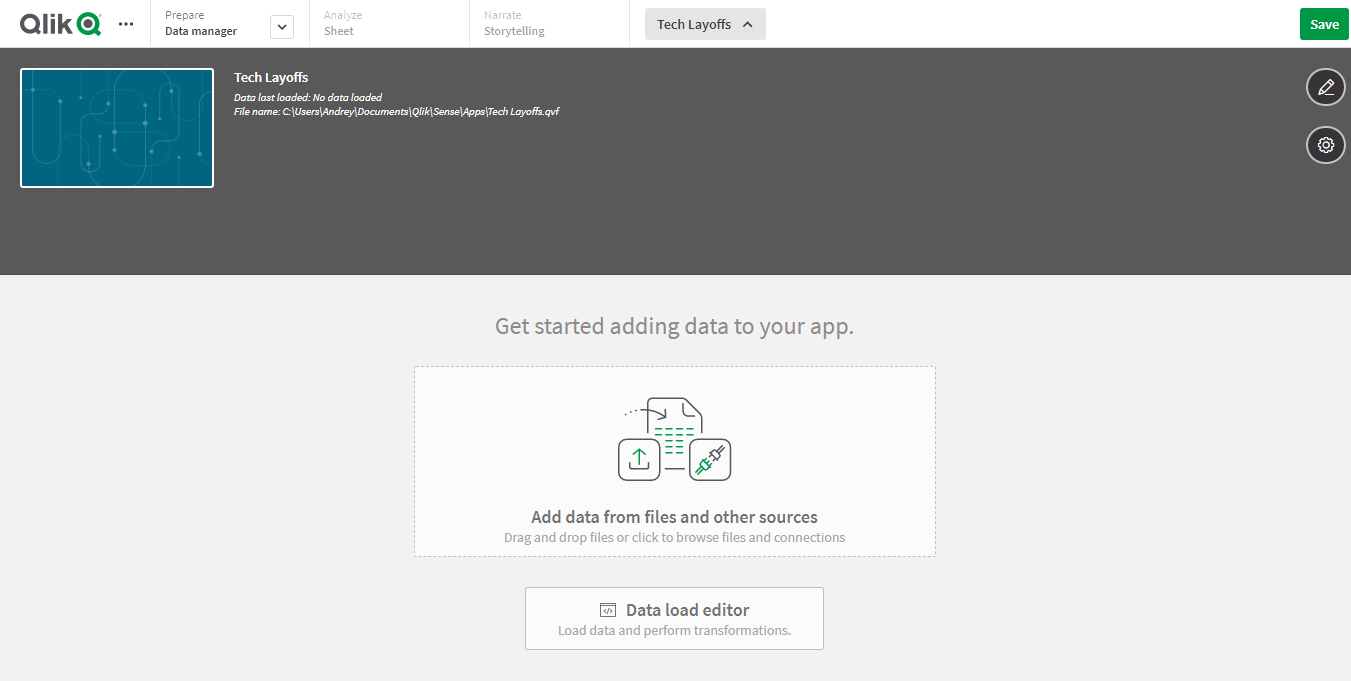
If you are starting from scratch, click on “Create new app” in the hub. Then just give your app a name, click "Create,” and open it.

Next, add the data to your app. Simply click on "Add data from files and other sources."
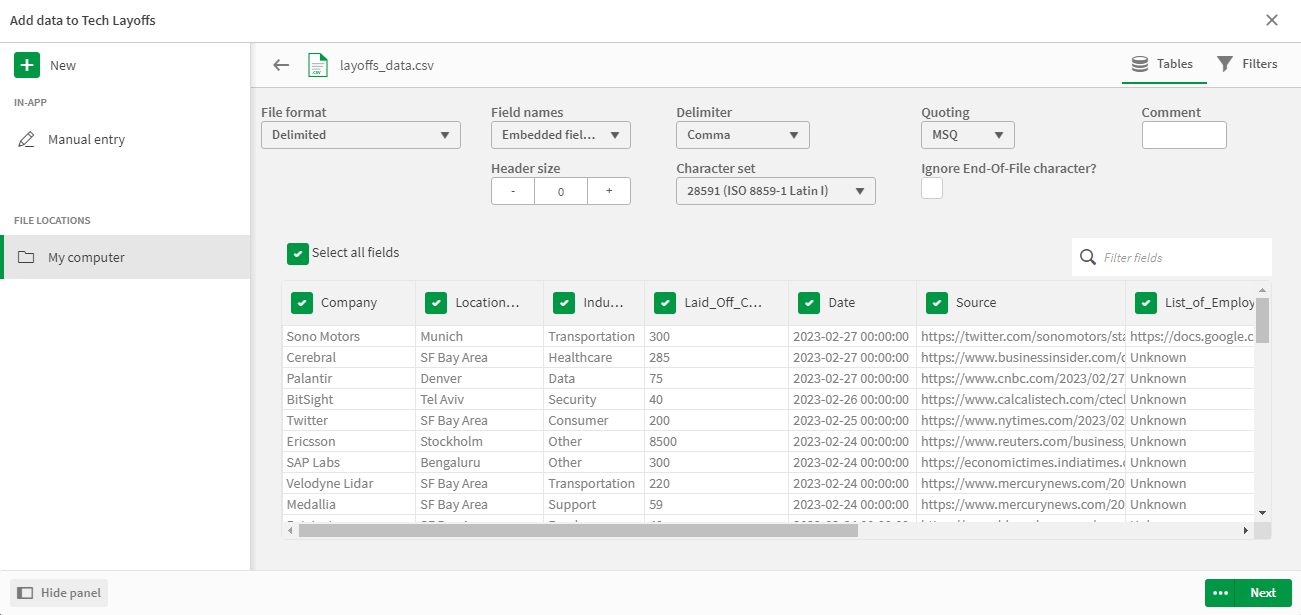
Since my data is in a CSV file, all I need to do is browse and select the file from the local system.
3. Add the extension
Now it's time to add the AnyChart Decomposition Tree extension to a sheet in your Qlik Sense app. Here's how:
- Open the sheet where you want to add the decomposition tree chart and click on "Edit sheet" in the top-right corner.
- In the pane, locate the AnyChart Decomposition Tree extension.
- Simply drag and drop the extension from the pane onto your canvas.
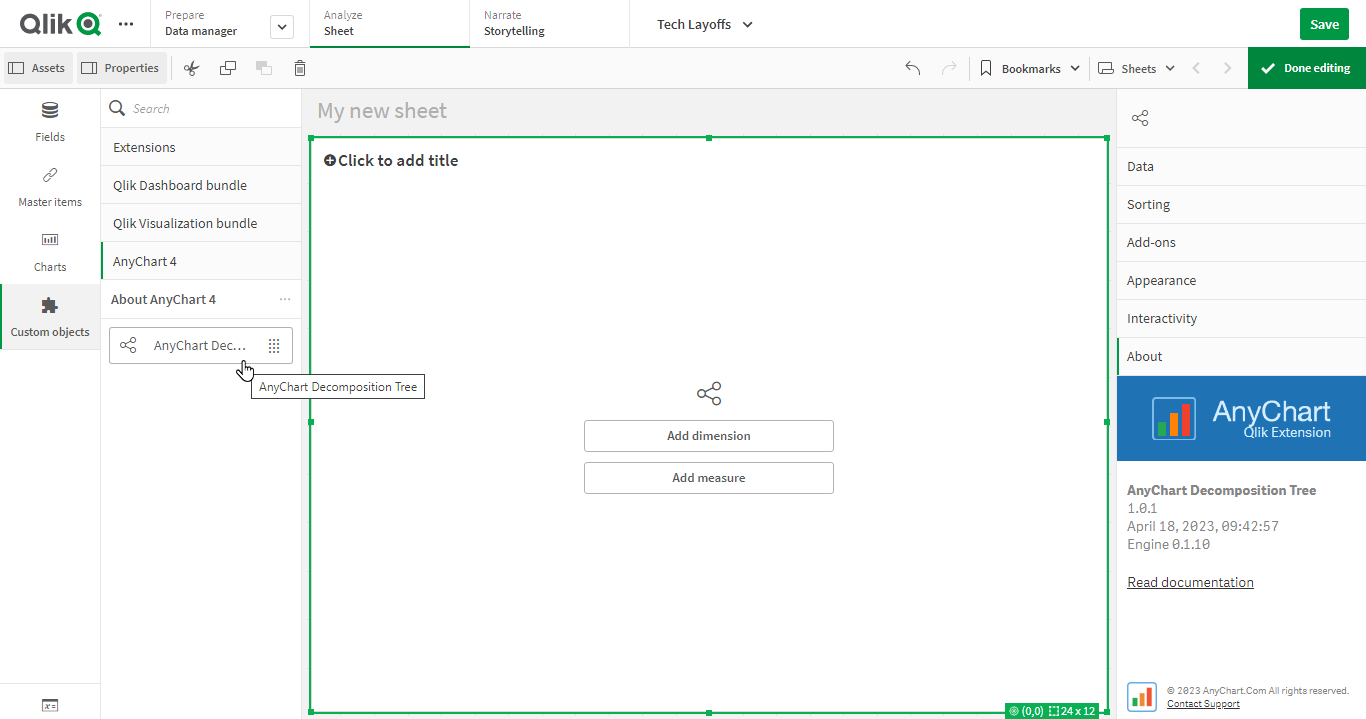
Voila! You now have an empty decomposition tree chart in front of you and you're all set to bring it to life with just a few more clicks. Let's nail it down.
4. Add a measure and dimensions
Finally, select a measure you want to disaggregate and dimensions for a breakdown. For that, you can use the respective buttons or navigate to the Data tab in the properties panel on the right side of the screen.
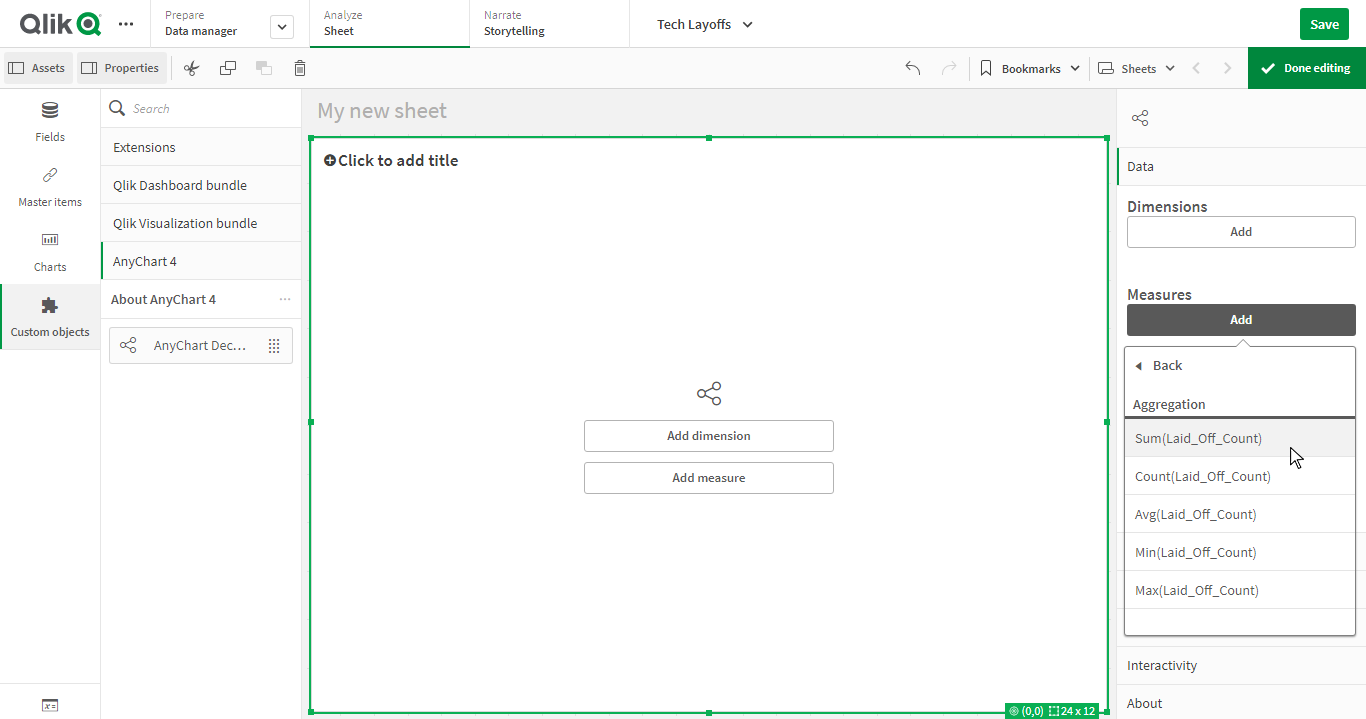
You can choose at least one measure (with the version 1.1.0 release, you can include multiple measures and smoothly switch between them) and at least one dimension to break it down.
In my case, the total number of tech layoffs is the metric (measure) that will be explored across the following six dimensions:
- Country
- Location
- Industry
- Company
- Year
- Month
Result
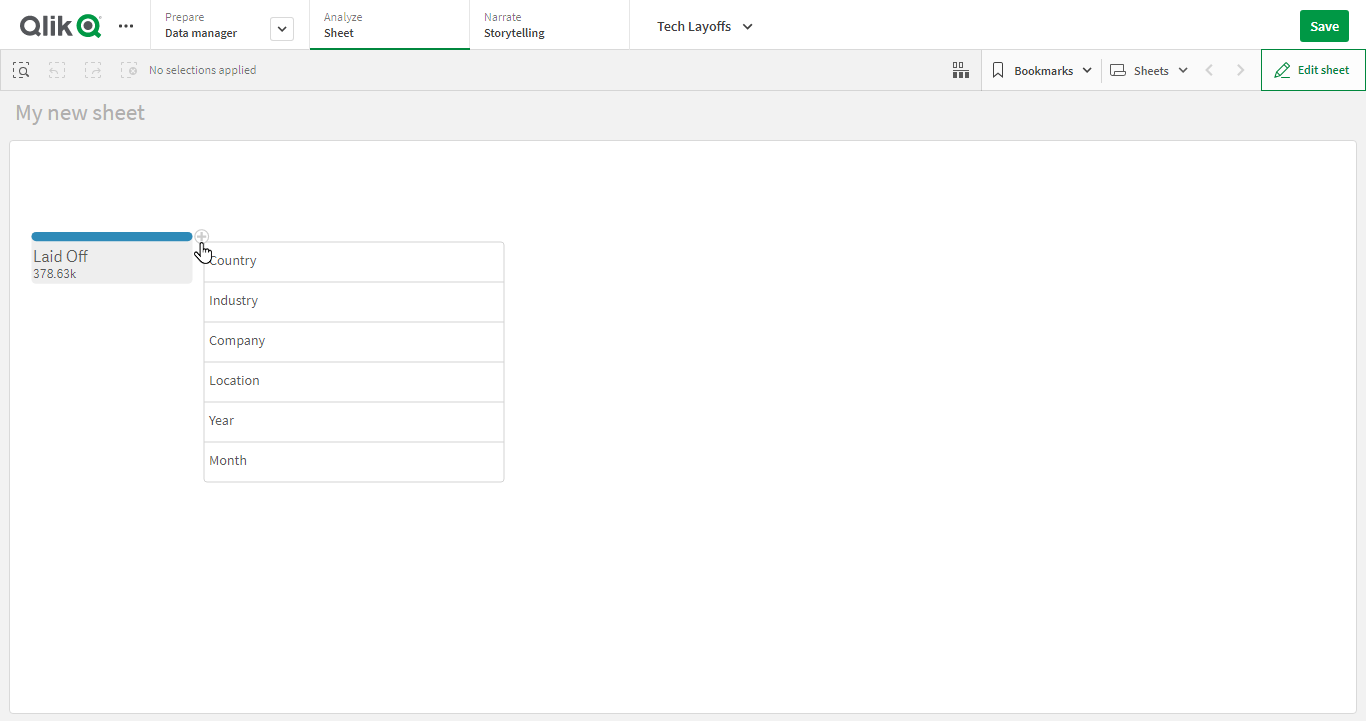
Once you’ve done all that, click "Done editing" in the top-right corner, and you’ll see a picture like below, which means your decomposition tree visualization is basically ready and waiting for your questions!
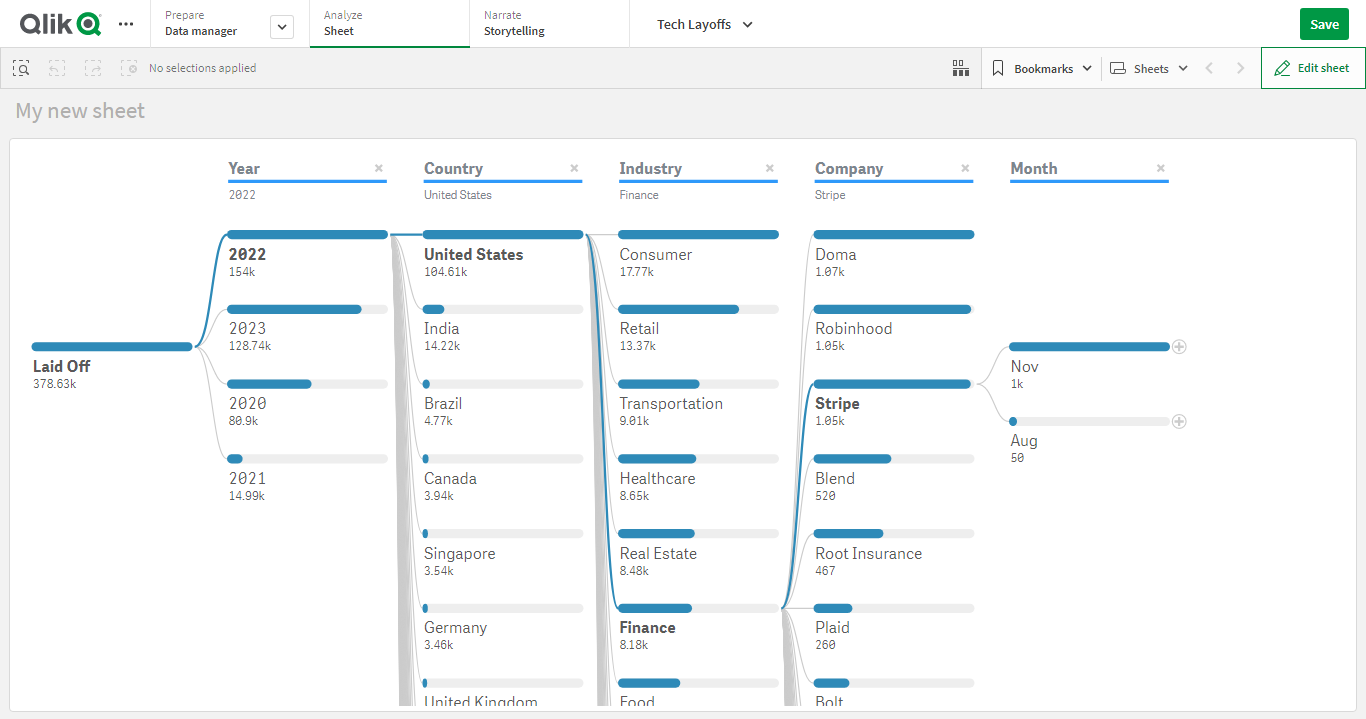
The beauty of the decomposition tree is that you don't have to worry about selecting the order of dimensions upfront because you’ve got the power to arrange them as you go, thanks to the magical Flex Dimensions feature. This makes the decomposition tree an ideal tool for ad-hoc data exploration, allowing you to drill down into different dimensions and uncover insights in a fluid and dynamic manner.
To explore the breakdown, simply hover over the root element, click on the "+" sign to the right of the value bar, and choose a dimension to dive deeper. This will reveal the major contributors within that dimension. You can repeat this process for other elements and dimensions you want to explore further. To change a dimension, simply click on the level header (breadcrumb), and to remove a dimension, click the "x" sign.
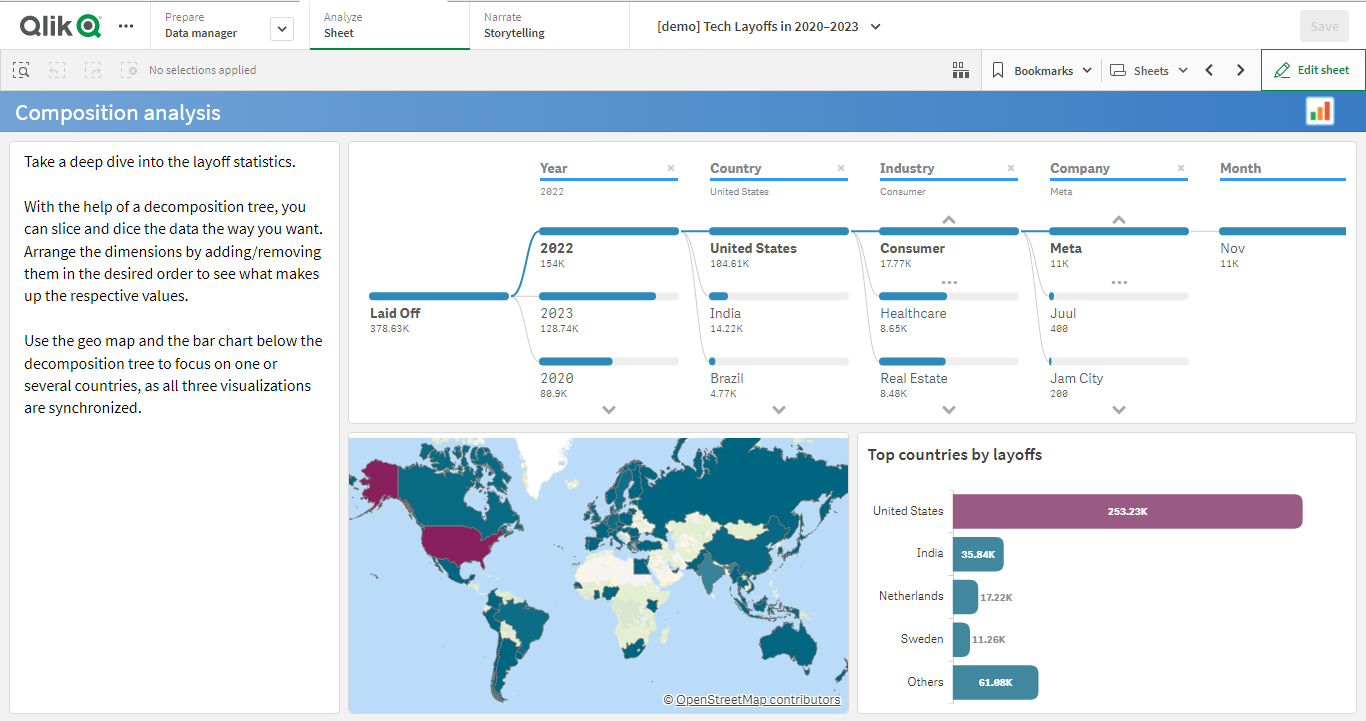
Check out the decomposition tree visualizing the tech layoffs data this way in the Composition Analysis sheet of the Tech Layoffs app. It's an excellent example of how this powerful tool can provide valuable insights.
Customizing Qlik Sense Decomposition Tree
Customizing your Qlik Sense Decomposition Tree opens up a world of exciting possibilities. Let's delve into some of the most intriguing customizations that you can apply to enhance your data visualization experience further.
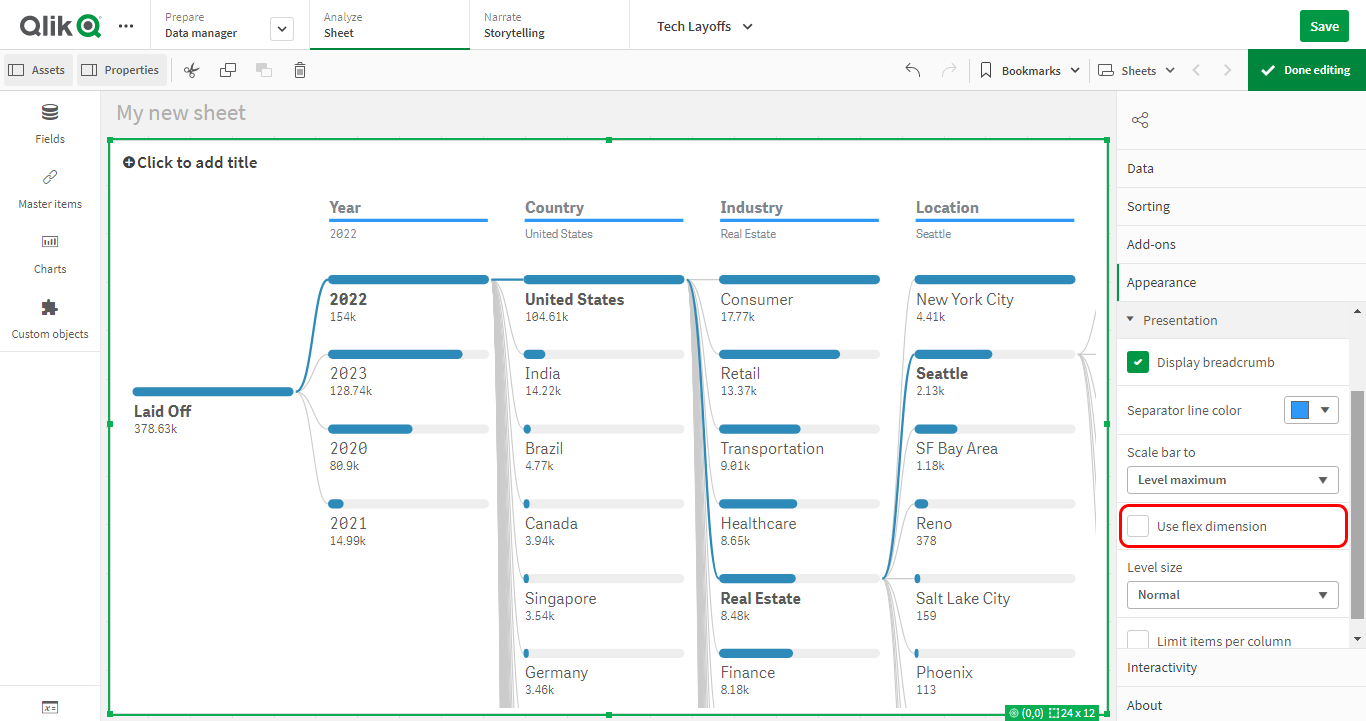
Fix the order of the dimensions
I’ve already explained that by default, the Flex Dimensions feature is enabled, bringing ad-hoc exploration to life. For explanatory purpose, if you prefer a fixed order of dimensions in the decomposition tree, you can easily achieve this by unchecking the respective box in the settings (Appearance > Presentation > Use flex dimension).
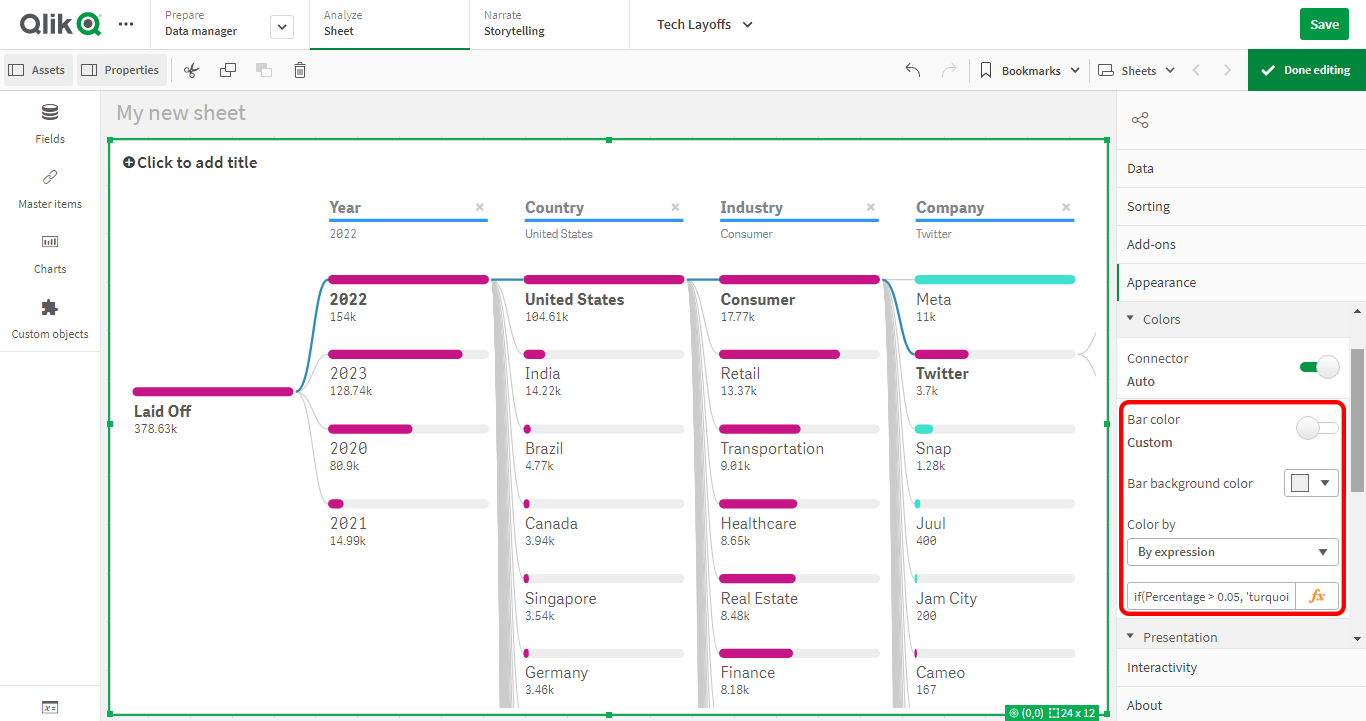
Apply custom coloring
You can modify the colors of bars in the Decomposition Tree visualization by accessing the Appearance > Colors section in the properties panel. Set the Bar Color toggle to "Custom," and from there, you have the option to set static colors, color by measure, or apply conditional coloring (color by expression) based on specific criteria.
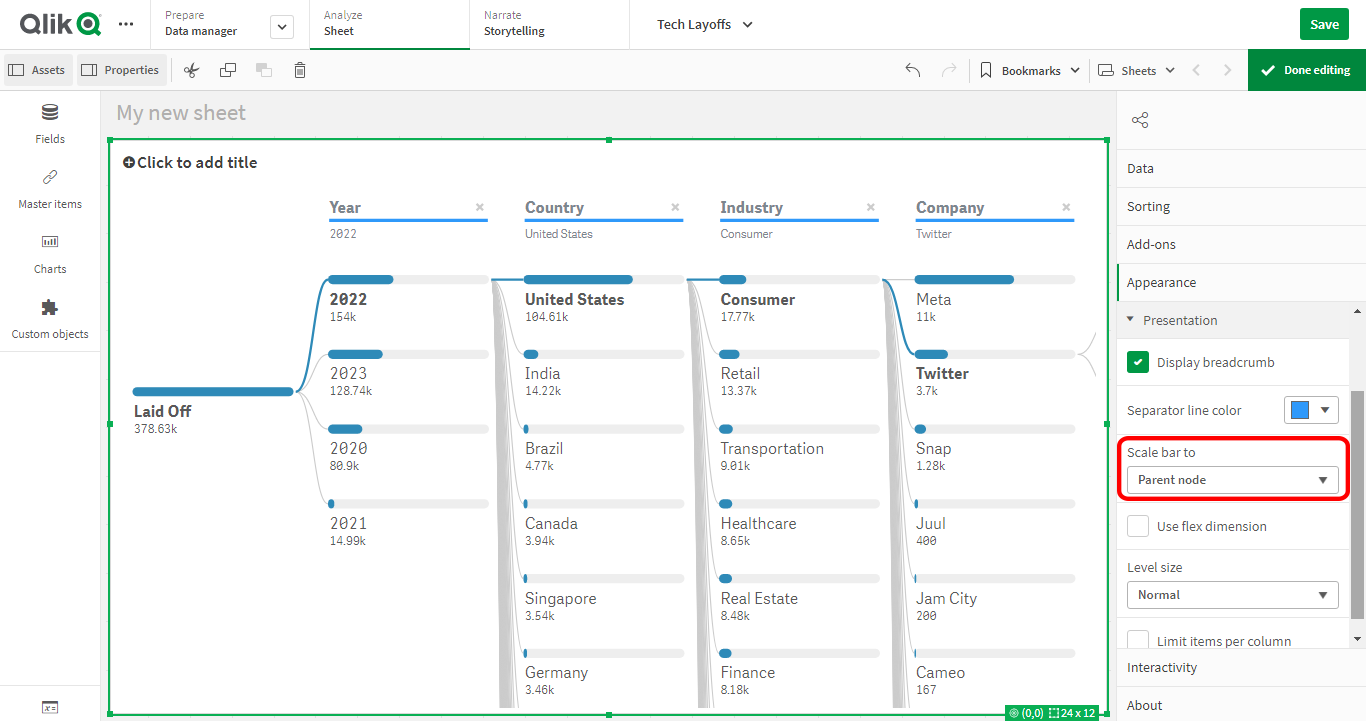
Modify the comparison scale
There are three methods to calculate the length of value bars in the decomposition tree:
- The default option is to calculate the length relative to the maximum value per level, allowing you to compare values within each level.
- You can also choose to calculate the length relative to the parent value, which helps you analyze contributions to the parent element.
- Alternatively, you have the option to calculate the length relative to the root element, providing insights into contributions to the total.
To modify this behavior, navigate to the properties panel and access the Scale Bar settings under the Appearance > Presentation section. From there, you can choose your desired calculation method from the dropdown menu.
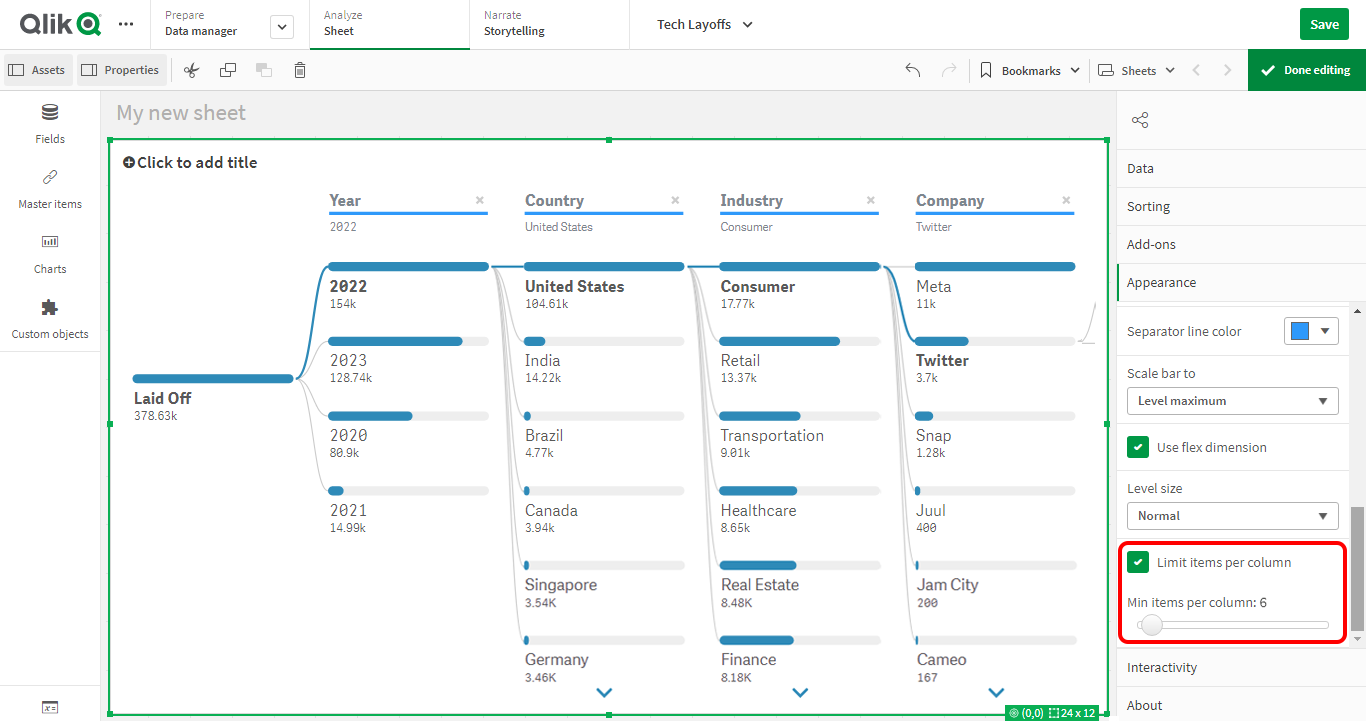
Configure paging
To control the number of elements shown on each level of the decomposition tree, you can enable paging. This feature allows you to adjust the display according to your preferences by limiting the number of items per column. Hidden elements can still be accessed through arrow controls for paging up or down, and you can reveal them by clicking on the triple dots.
To enable paging, navigate to the properties panel and locate the Appearance > Presentation section. Look for the Limit items per column option and check the checkbox. Once enabled, only screen-fitting elements are displayed, and you can use the Min items per column slider to specify the minimum number of elements visible on each level.
More options to customize a decomposition tree
Customization possibilities for your decomposition tree in Qlik Sense are quite endless! You can hide breadcrumbs, switch to a compact or wide view, disable selection and tooltips, and more.
To learn how to configure various options, check out the decomposition tree documentation. Get ready to unleash your creativity and make your decomposition tree truly unique!
Wrapping Up
Congratulations on mastering the art of creating a decomposition tree in Qlik Sense! Now you have the power to unearth hidden insights, visualize intricate data hierarchies, and make well-informed decisions through comprehensive analysis.
With its user-friendly interface and a wide range of customization options, the decomposition tree becomes an invaluable tool for data analysts and visualization enthusiasts alike. So go ahead, embrace the possibilities that Qlik Sense (with AnyChart) offers. And let the decomposition tree take your data exploration to new heights.
Happy Qlikking!
Author: Alejandro Wassermann, an experienced BI developer based in Argentina, a certified Qlik Sense Architect and Microsoft Power BI Data Analyst Associate.