
Circular gauge
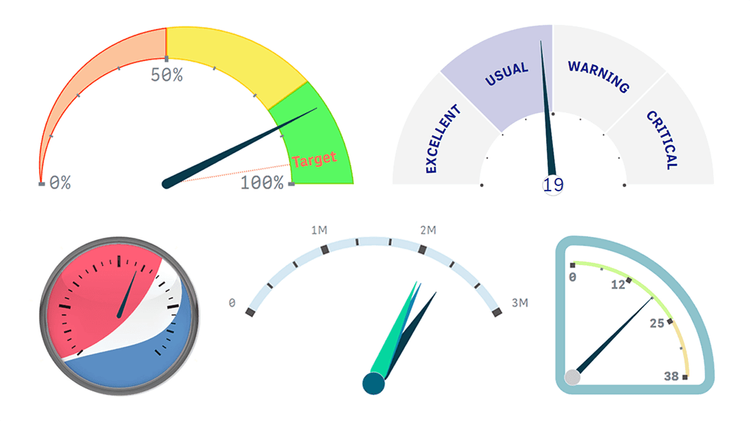
Custom Circular Gauge Features
Move far beyond Qlik's native capabilities for KPI visualization with the advanced, genuine circular gauge that can represent more than only a single measure value and provide more context! Explore all major features of our intuitive Circular Gauge Extension for Qlik Sense while checking out various custom gauges perfectly suitable for diverse use cases. See multiple options for pointers, shapes, angles, sizes, and much more demonstrated in action.
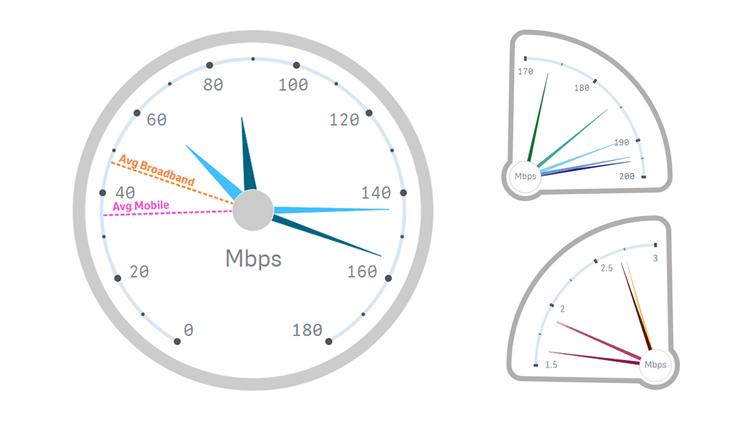
Worldwide Internet Speed
Analyze internet speeds around the world using Ookla data that is visualized in stunning circular gauges created with our intuitive Qlik Sense extension. Begin with an at-a-glance overview of average fixed broadband and mobile (cellular) connection speeds in all countries. Then, find out the fastest and slowest internet speeds by type of network, on each continent and globally. Lastly, compare the internet speeds of any two countries or continents.
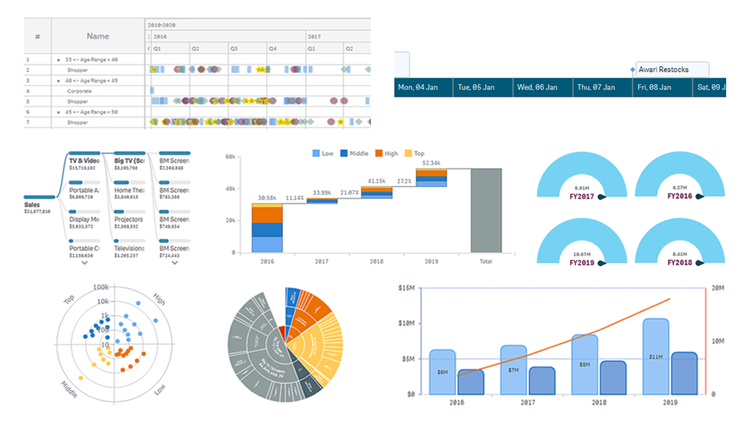
AnyChart Complex Demo
Named best in data analytics and visualization in 2023, AnyChart offers a set of innovative Qlik Sense extensions. Discover the power of the major ones in a quick demo overview and see how they can help you take your visual analytics in Qlik to the next level: Decomposition Tree, Gantt Chart, Combo Chart, Circular Gauge, Bullseye Chart, Sunburst Chart, Timeline Chart, and Waterfall & Advanced Waterfall Chart.
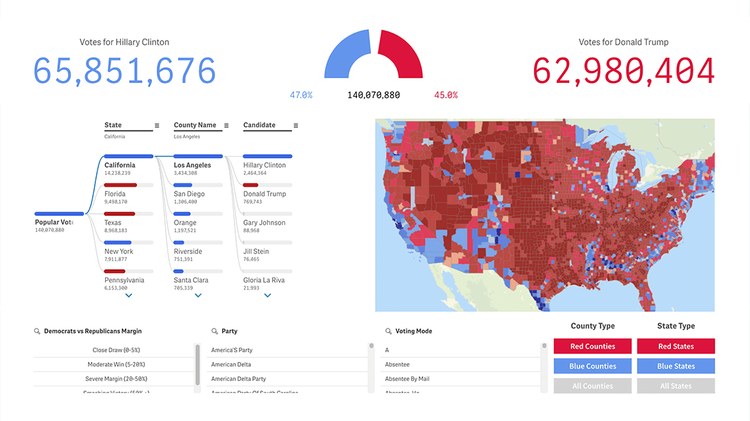
U.S. Presidential Elections
Gain a deep understanding of U.S. presidential election dynamics. Analyze the results of the elections through interactive visualizations, including maps, decomposition trees with AI Splits, circular gauges, and more. Dive into popular and electoral vote data at national, state, and county levels. Explore swing state impacts, third-party influence, and even fictional write-ins — from Daenerys Targaryen to Donald Duck. Discover trends, margins, and patterns that shaped America's choice — with plans to expand all the way back to George Washington.