
U.S. Presidential Elections
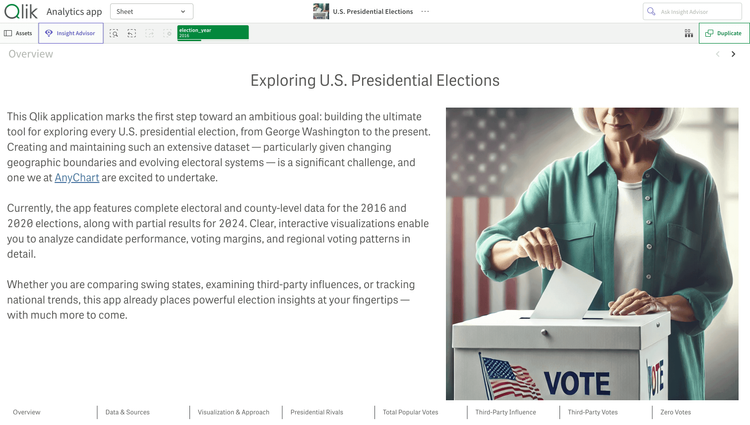
Explore U.S. presidential election results in depth through rich interactive data visualizations powered by Qlik Sense and AnyChart extensions.U.S. Presidential Elections


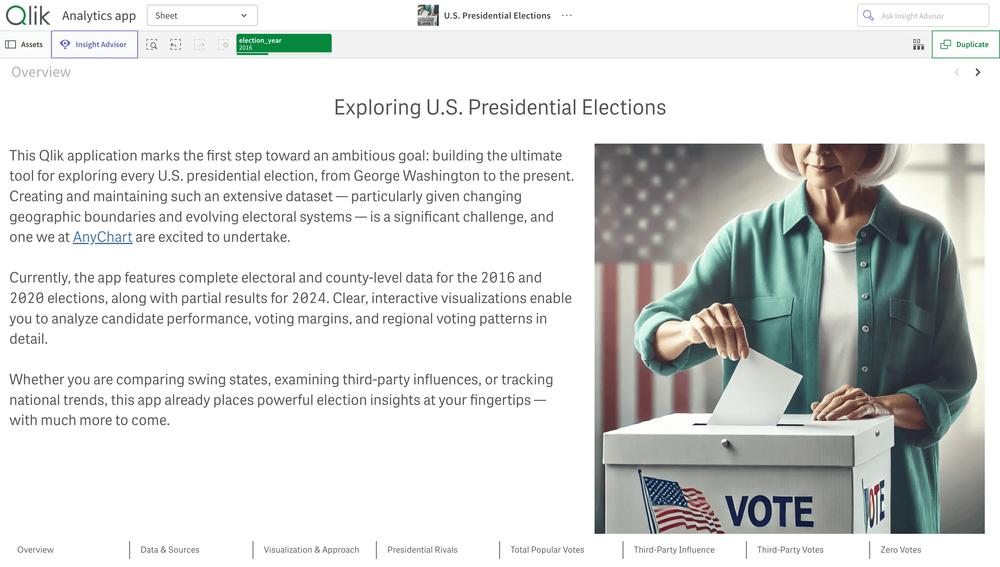


About this app
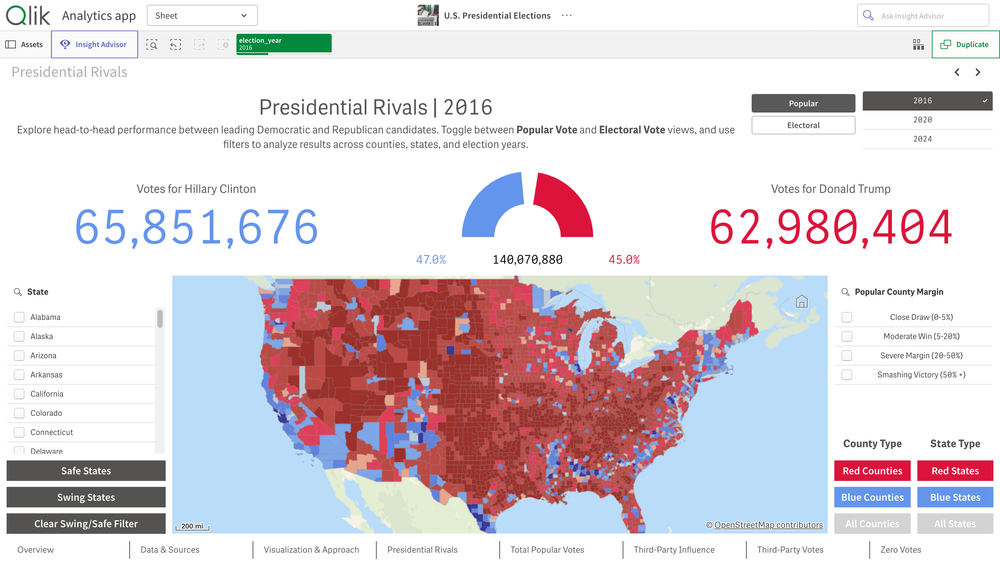
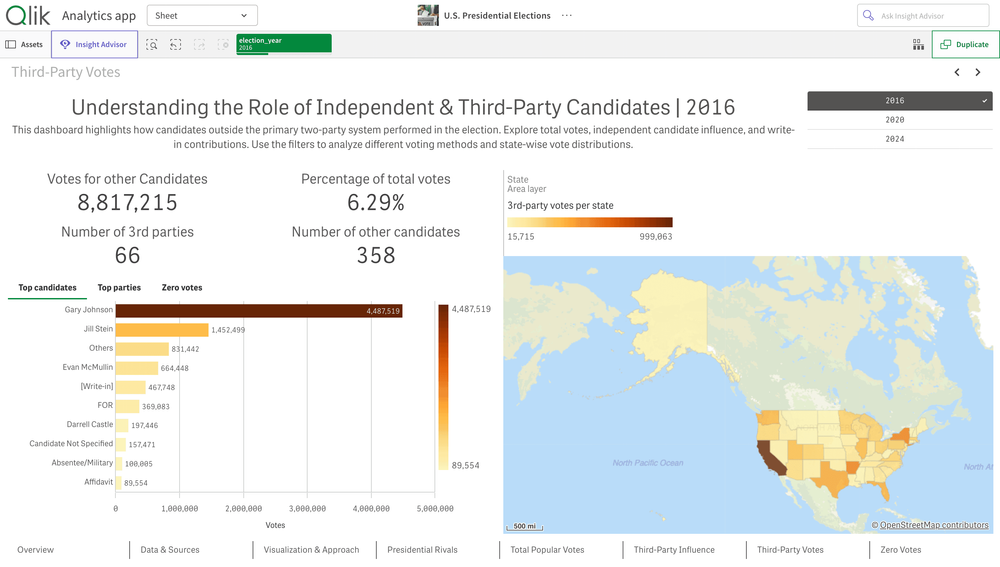
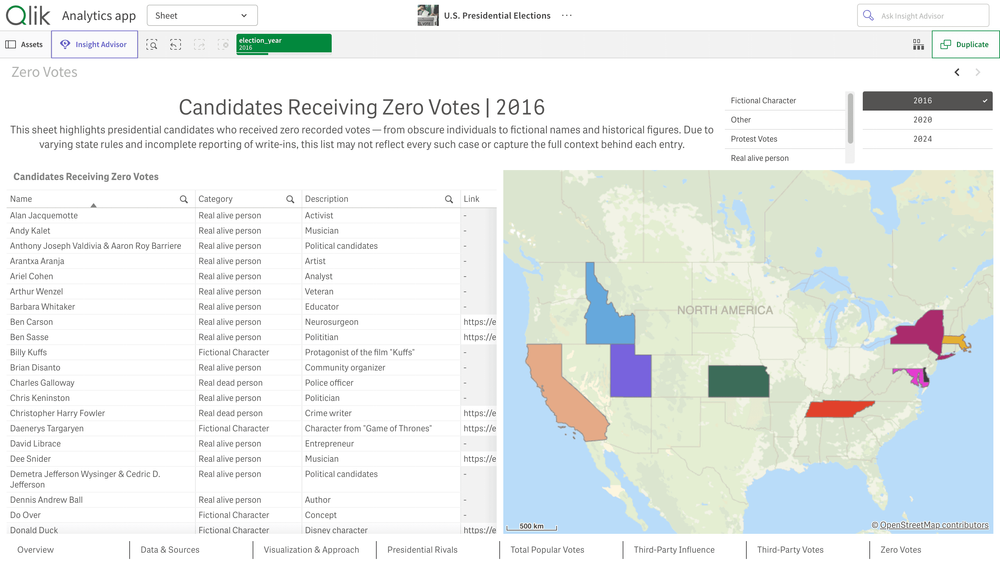
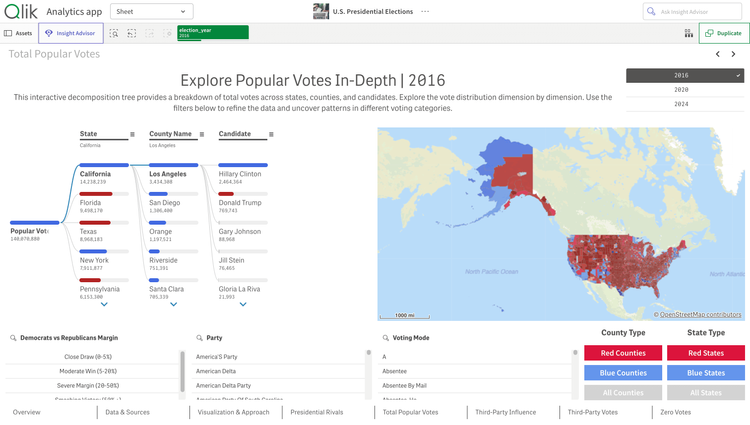
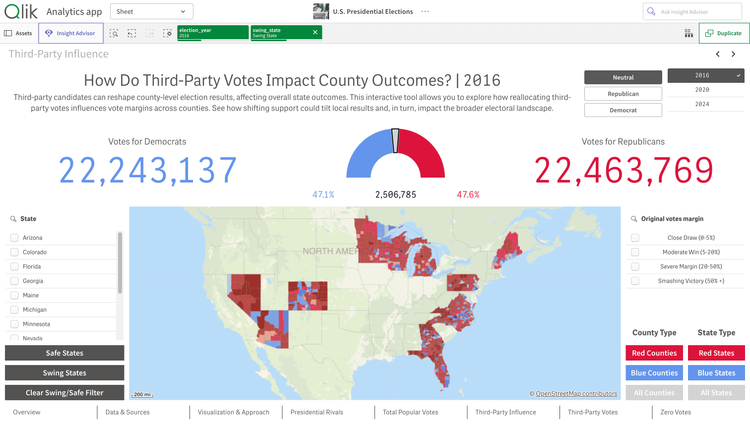
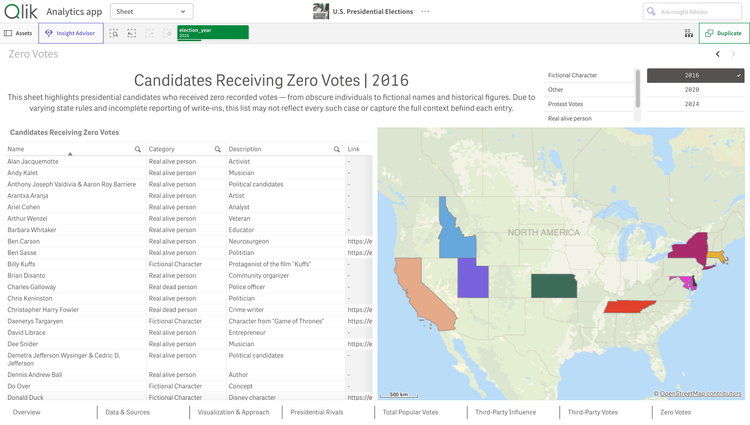
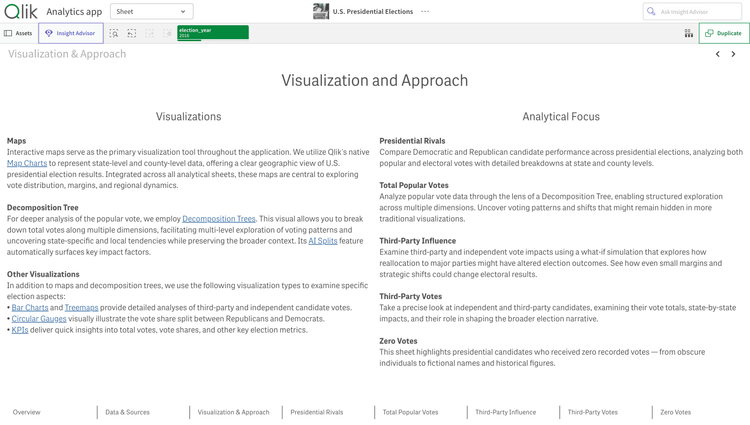
Gain a deep understanding of U.S. presidential election dynamics. Analyze the results of the elections through interactive visualizations, including maps, decomposition trees with AI Splits, circular gauges, and more. Dive into popular and electoral vote data at national, state, and county levels. Explore swing state impacts, third-party influence, and even fictional write-ins — from Daenerys Targaryen to Donald Duck. Discover trends, margins, and patterns that shaped America’s choice — with plans to expand all the way back to George Washington.
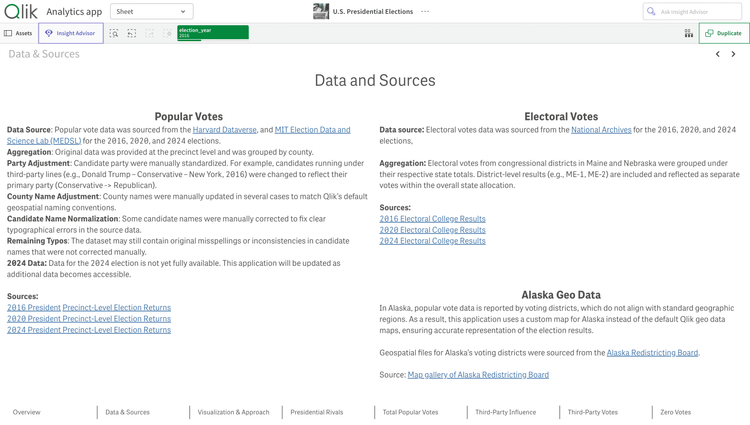
This Qlik Sense application features a Decomposition Tree and Circular Gauge visualizations powered by AnyChart's extensions for Qlik Sense. Data is sourced from Harvard Dataverse and the MIT Election Data and Science Lab (MEDSL).