
We continue a series of tutorials delving into the details of how to create Gantt charts in Qlik Sense and customize them using our intuitive AnyGantt Extension. This time, let’s look at configuring Gantt chart labels.
You can watch the video version of this tutorial below or keep reading to see it in the text and pictures.
What Are Gantt Chart Labels?
Gantt chart labels are text objects that display additional information about elements of a Gantt chart.
Each Gantt chart element has its own label settings. You can configure the text, position, background, and font.
Adding Labels to Gantt Chart Elements
By default, there are no labels on the Gantt chart in AnyGantt Extension for Qlik Sense.
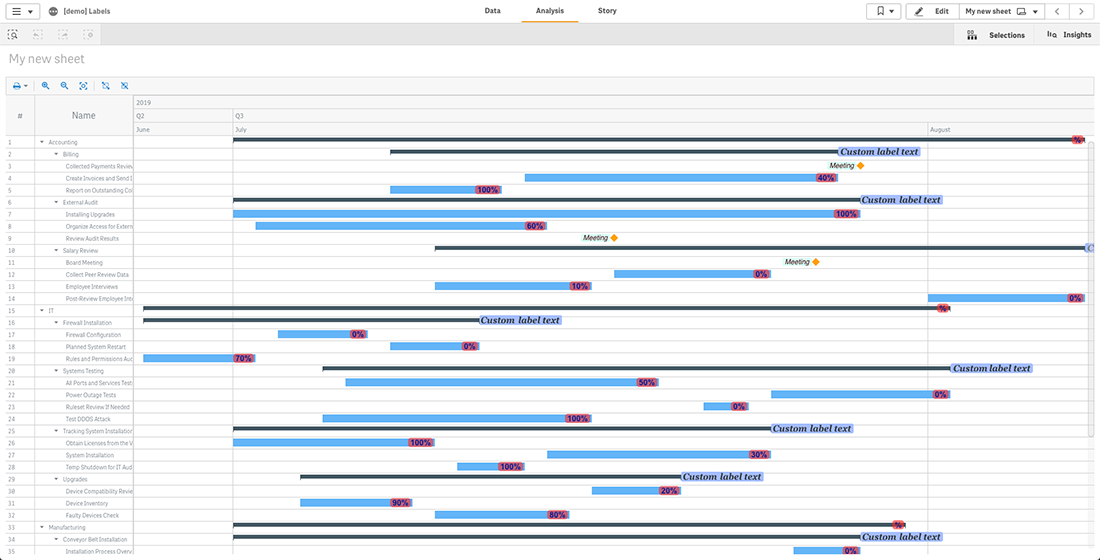
To enable them for a certain element, just set its label text. AnyGantt will display labels in each row where this element appears.
To add labels to an element, in the properties panel go to “Add-ons” > “Label settings“.
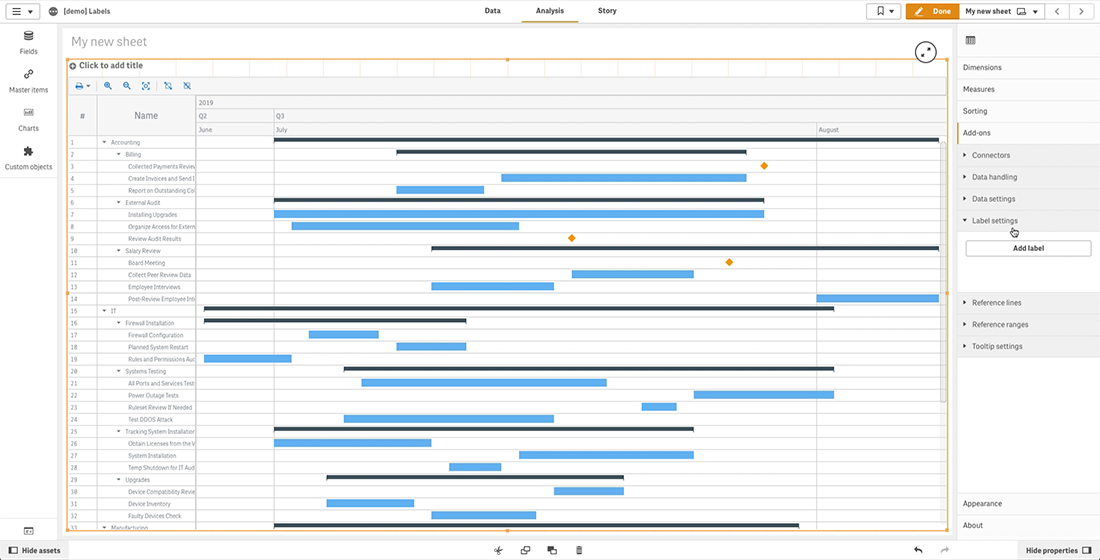
Click “Add label” and select an element from the first drop-down menu. For example, let’s select actual bars.
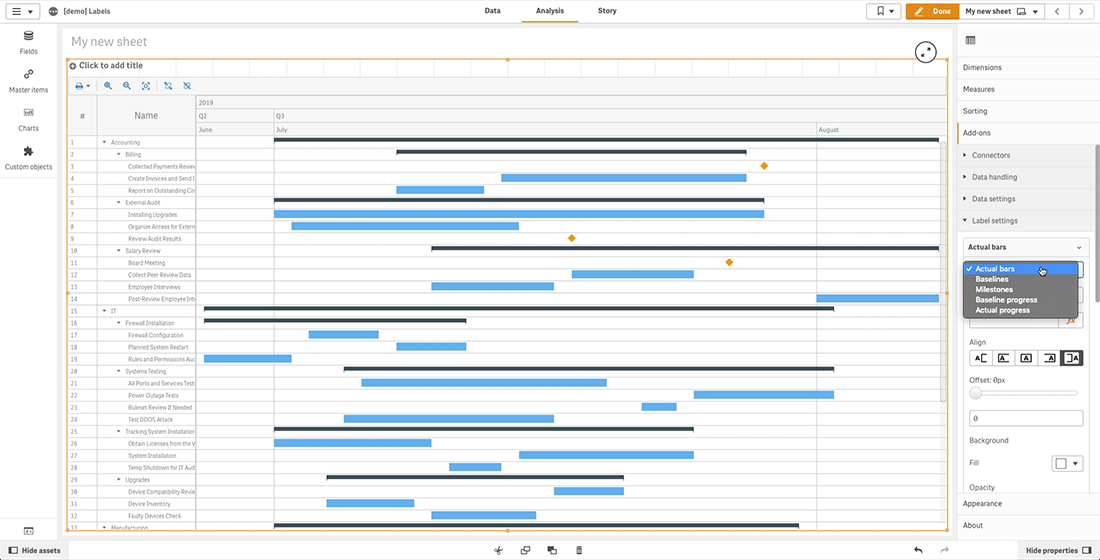
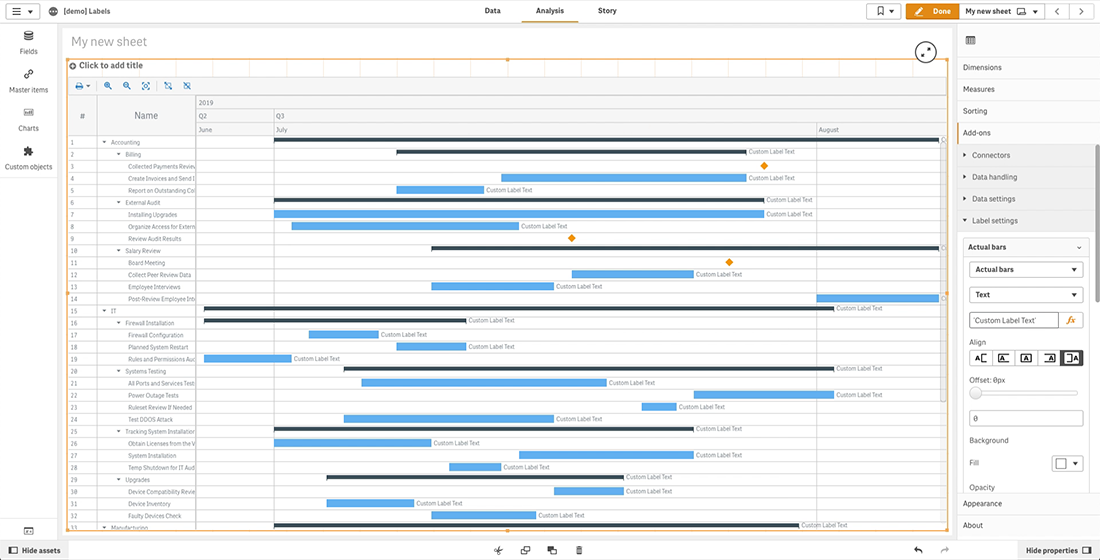
Then select the “Text” option in the second drop-down menu. In the input box below, you can enter a string value.
You can also set the label text as a string expression. For example, let’s set an expression displaying a single field which contains project task names.
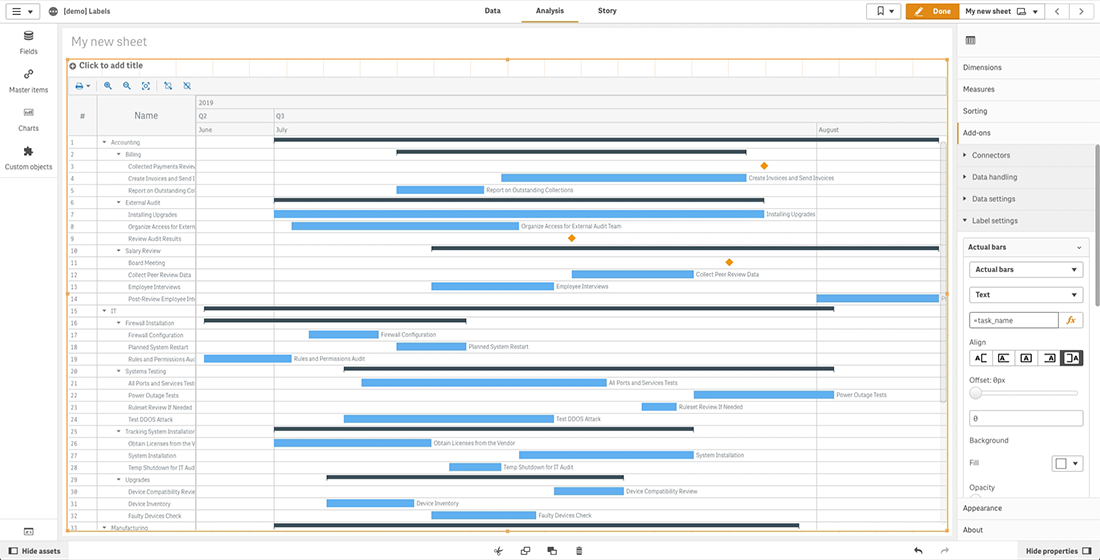
It is also possible to display values not included within a visualization. For example, here we can use the “employee_name” field to show names of employees assigned to tasks.

An expression can display a calculated value. For example, the progress as a percentage.
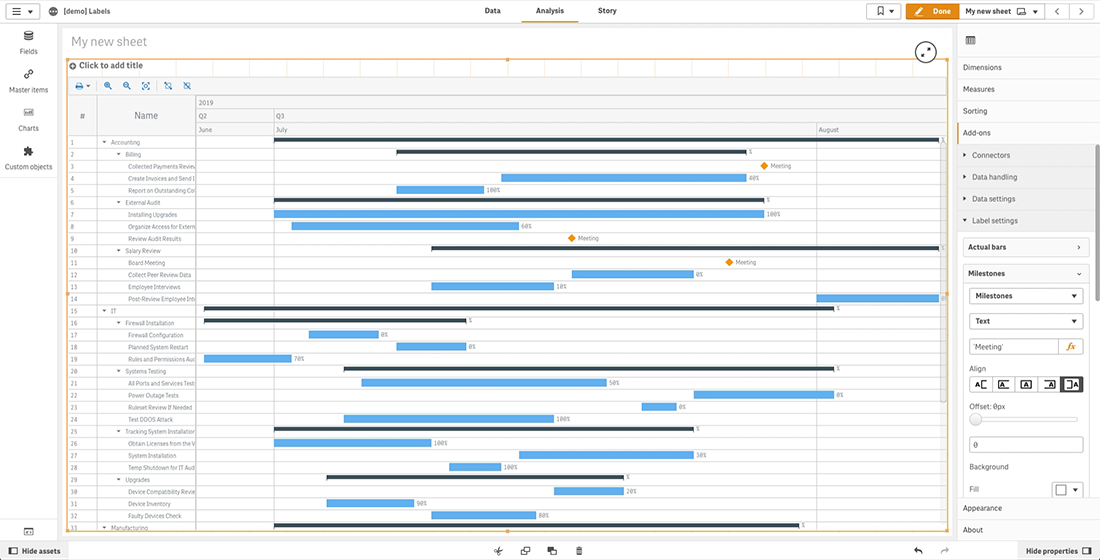
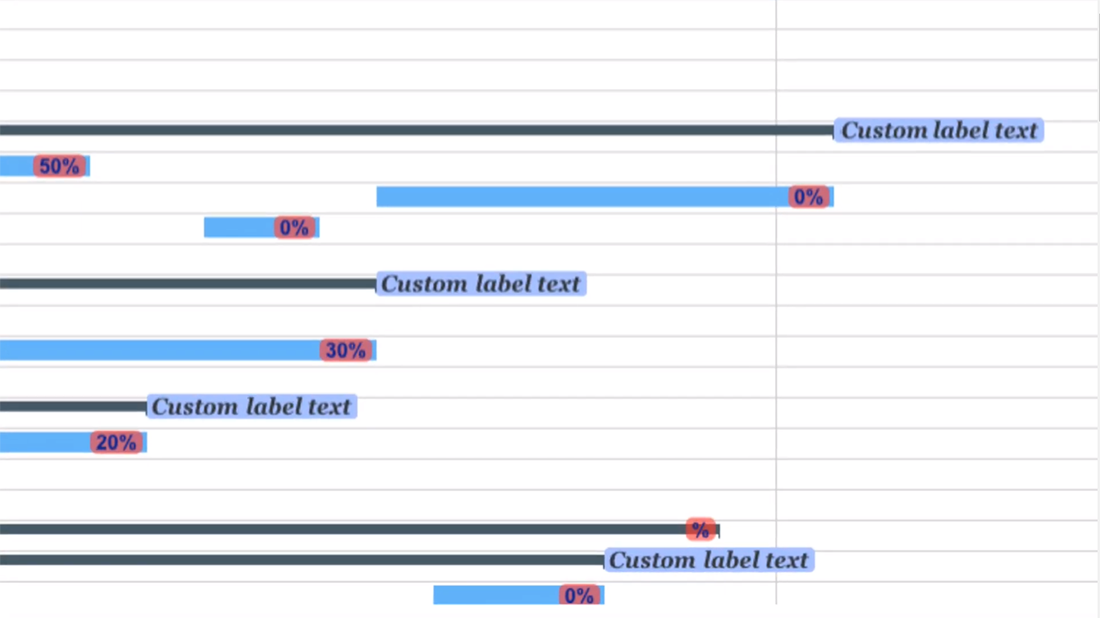
The following illustration shows a Gantt chart displaying a string value in labels of milestones.
Configuring Labels in Gantt Charts
Each element in a Gantt chart for Qlik Sense has its own label settings. Before, we added labels to actual bars and milestones. Now, let us configure both.
To configure the position, background, and font of labels, return to “Add-ons” > “Label settings” in the properties panel. We can start with configuring labels of actual bars.
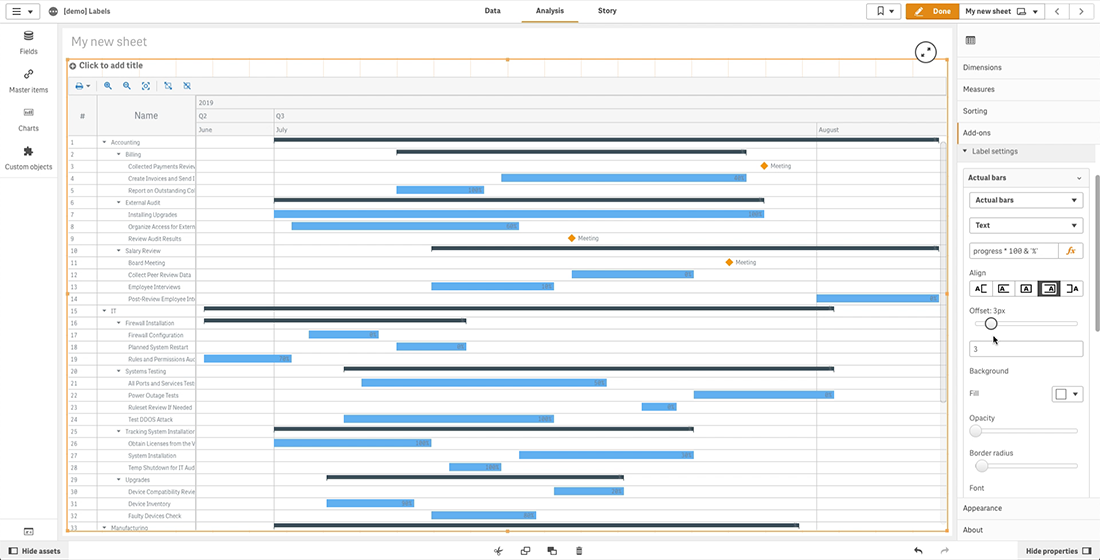
To set the position, use “Align” and “Offset” options.
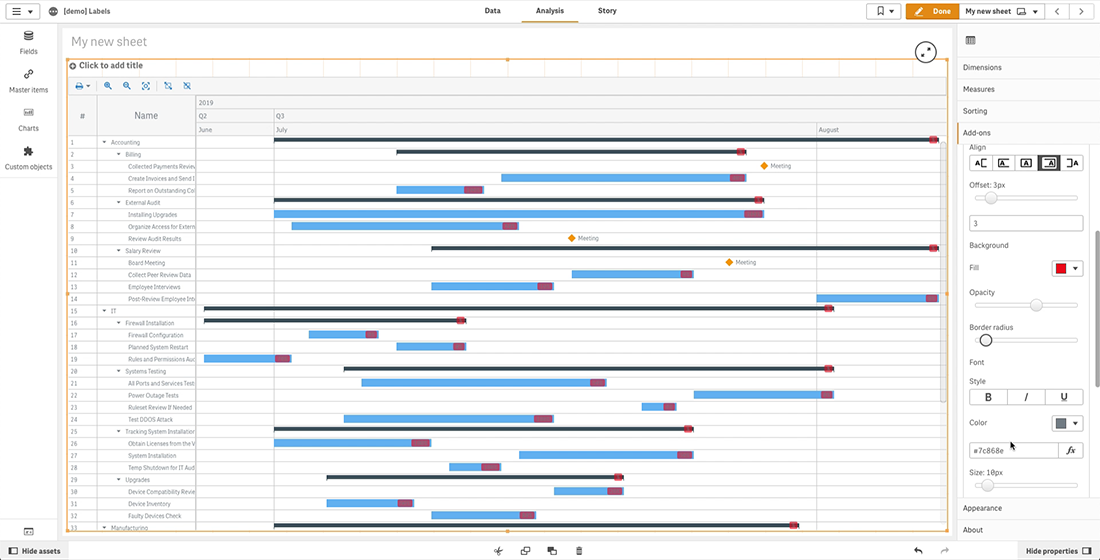
To configure the background, go to “Background” and use the “Fill“, “Opacity“, and “Border radius” options.
To configure the font, go to “Font” and use the “Style“, “Color“, “Size“, and “Family” options.
For milestones, the same options are available.
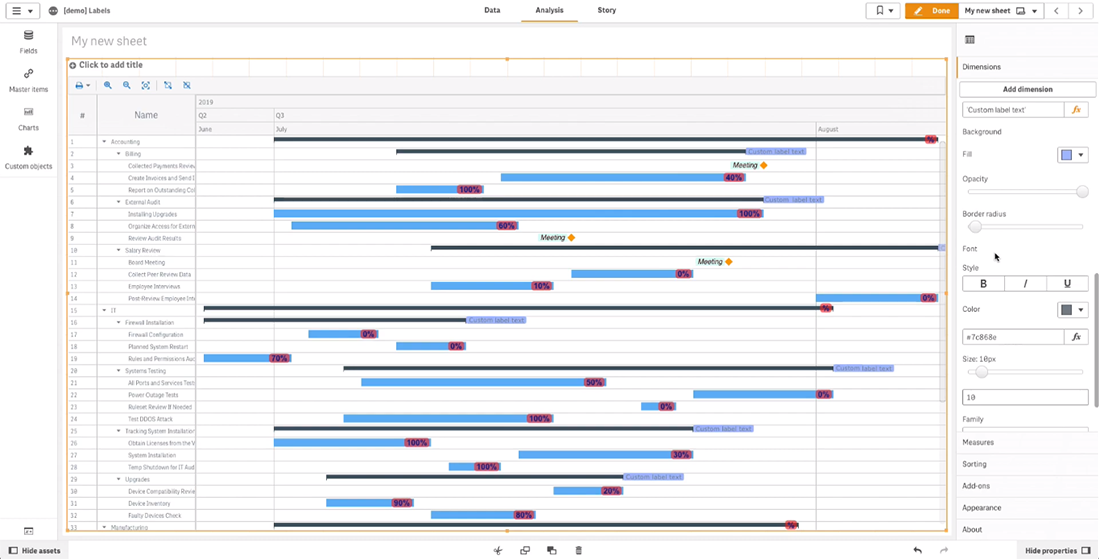
Adding Labels to Dimension Bars
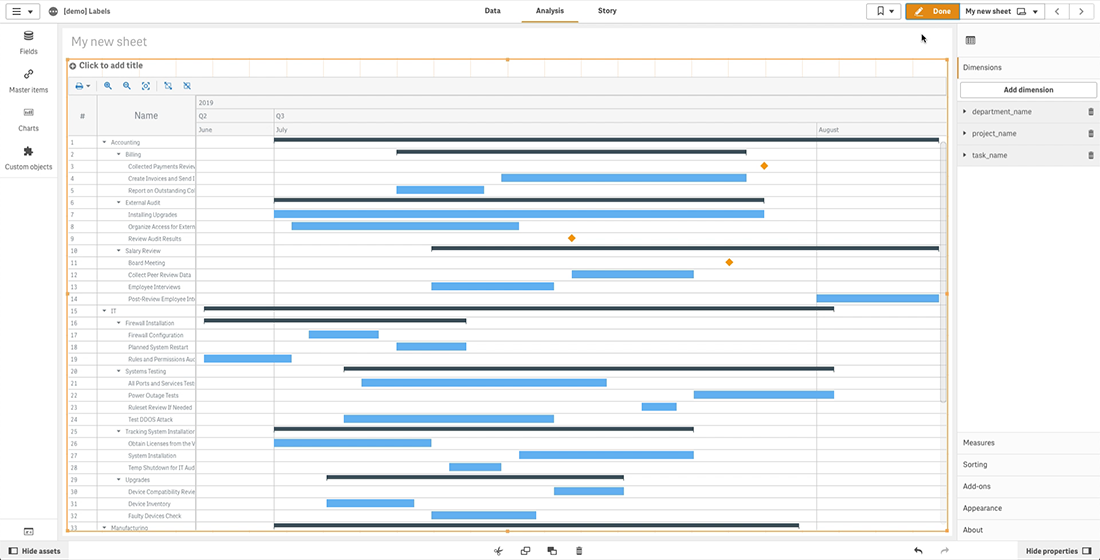
To add labels to dimension bars (separately for each dimension), you should go to “Dimensions” in the properties panel.
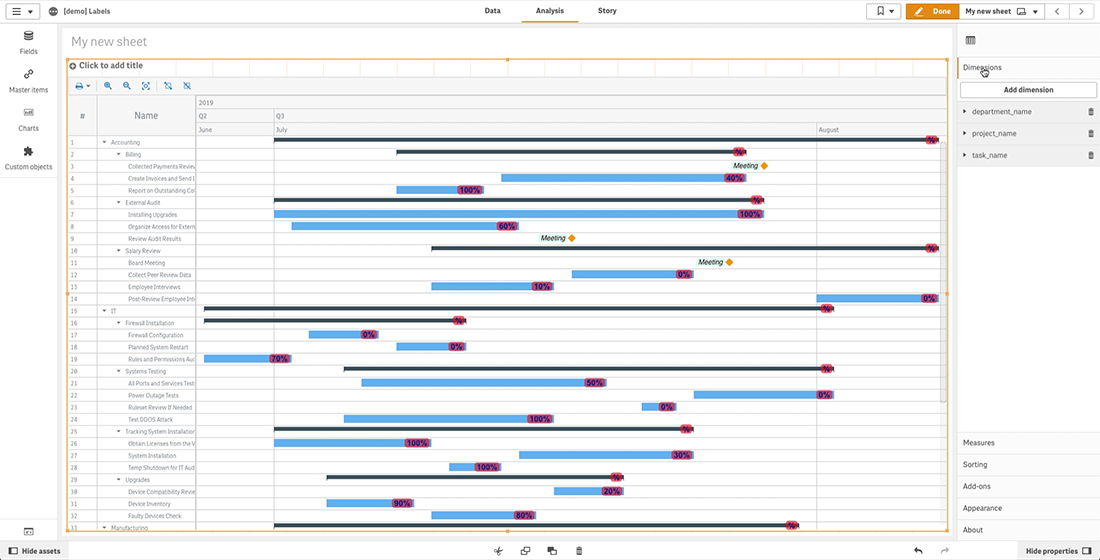
Click a dimension to open its settings. Then go to “Label” and select the “Text” option in the drop-down menu. Enter a string value or a string expression in the input box below.
You can configure the background and font of these labels.
To configure the background, go to “Background” and use the “Fill“, “Opacity“, and “Border radius” options.
To configure the font, go to “Font” and use the “Style“, “Color“, “Size“, and “Family” options.
Questions About Gantt Chart Labels in Qlik Sense?
Get in touch if you still have questions about how to configure and work with labels in Gantt charts in Qlik Sense when using AnyGantt Extension for project data visualization and analytics. You can ask in the comments below or contact our support engineers directly at support@anychart.com.
Looking for other chart types in Qlik Sense? Don’t forget that we also launched two other intuitive extensions within the framework of our Qlik technology partnership — AnyStock, for stock and any time-series charts, and AnyChart, with more than 30 more charts for Qlik Sense.