
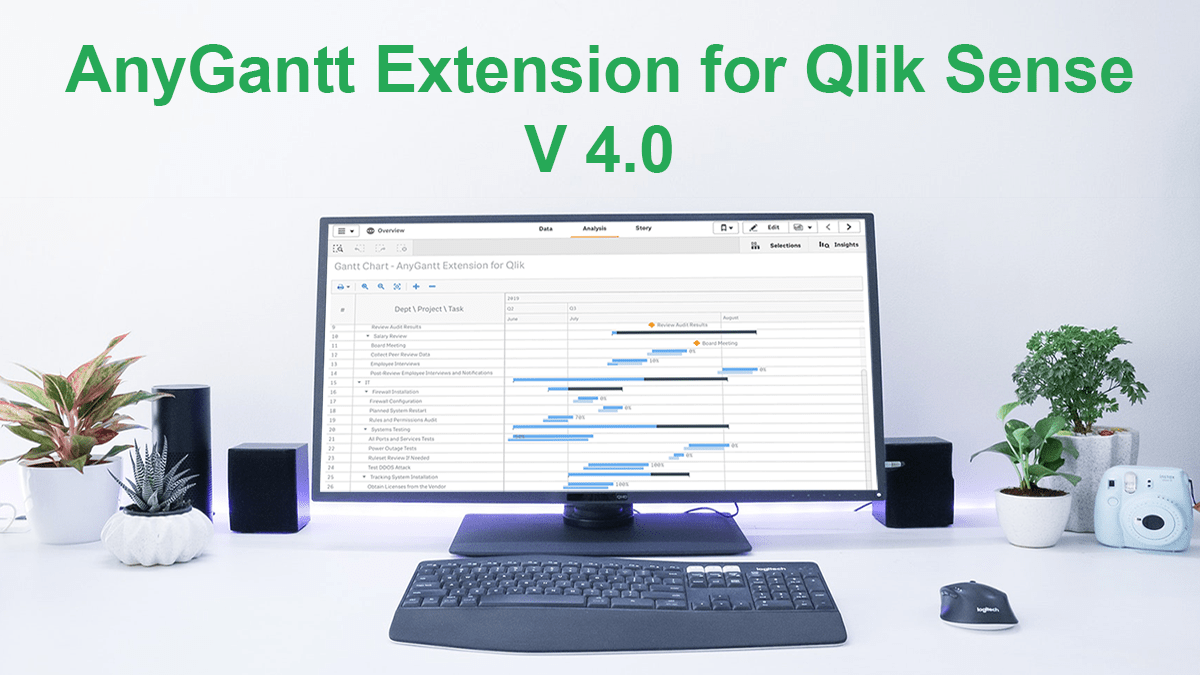
Good news, Qlikkies! We’ve released a major update to our Qlik Sense Gantt chart extension AnyGantt, bringing a bunch of new awesome features to further improve your project and resource data visualization experience using it. Look what’s new in version 4.0!
What’s New in AnyGantt Extension V 4.0
1. Cascade Coloring of Rows
In the 4.0 release, we’ve introduced two pre-built coloring patterns for rows.
One of them is cascade, which implies that each next nesting level is colored lighter than the previous one while staying within the same hue. This is designed to streamline the visual perception of nesting.
2. Odd-Even Coloring of Rows
The other row coloring pattern delivered in version 4.0 of the AnyGantt extension can be applied to get odd and even rows colored differently.
This style is expected to help data analysts better recognize which row one Gantt chart element or another belongs to.
3. Expanded/Collapsed by Default
We’ve further extended the default state settings.
In particular, you can easily make a Gantt chart appear collapsed down to the top nesting level, facilitating the initial general overview of the project progress or resource allocation.
4. Connectors
Now it is possible to show dependencies between tasks in a project by means of displaying connectors that link one activity to another.
5. Export, NPrinting, and Snapshots
Meet the full-fledged support of exporting to PNG, PDF, and NPrinting as it is already added to our AnyGantt extension for Qlik Sense!
Snapshots properly show the state of the Gantt chart: zoomed in/out, expanded/collapsed, etc.
6. Calculation Condition
You can now specify an expression in a text field to set a condition that needs to be fulfilled (true) for the object to be displayed. The value may be entered as a calculated formula. For example: count(distinct Team)<3. If the condition is not fulfilled, the message or expression entered in Displayed message is shown.
A calculation condition is useful when a chart or table is very big and makes the visualization slow to respond. A calculation condition can then help so that for example an object does not show until the user has filtered the data to a more manageable level by applying selections.
7. Showing Measures as Columns in Resource Chart
In the new version, we’ve also provided Resource Charts with the capability to visualize measures as columns on the data grid — like in Project Charts.
This allows additional information about the elements of a Resource Gantt Chart diagram to be neatly displayed.
8. Table Header Settings
Table headers can now be stylized to the full extent.
In particular, it is possible to customize the background color, font, as well as the text.
9. Row Numbering
Now you can apply a numbering scheme to the rows in your Gantt Chart.
There are currently three options available out of the box:
- single-level, i.e. consecutive numbering — when all elements are numbered one by one in regular ascending order, e.g. 1, 2, 3, and so on;
- multi-level, i.e. hierarchical numbering — when top-level elements are numbered 1, 2, 3, and so on, second-level elements are numbered 1.1, 1.2, 1.3, 1.4, and so on, etc.;
- custom — to be determined using a function.
10. Label Position Settings
Last but not least, we’ve brought a set of UI controls to facilitate arranging a desired position for labels within or beyond task bars:
- inside a bar — alignment to the left, center, or right;
- outside — sticking to the bars’ left or right sides.
Your Feedback Matters
We invite all Qlik users including Qlik luminaries to share your feedback with us. Your opinion on what else should be added to or changed in the AnyGantt extension indeed means a lot to us as we’ve always planned the development roadmap for our Gantt Project and Gantt Resource charts based on your requests, suggestions, and tips.
The same applies to our two other powerful data visualization extensions for Qlik Sense: AnyChart — with over 30 basic chart types, and AnyStock — with charts for stock and other time-series data. We keep working hard to make them even better as well and will highly appreciate your ideas regarding them too.
Just tell us what you need and we’ll deliver it.
In the meantime, enjoy the new, 4.0 version of our Qlik Sense Gantt chart extension AnyGantt!
If you have not tried our extensions for Qlik Sense yet, give them a try for free right now and schedule a call with us for a personalized demo.