
Great news for Qlikkies: We released another major update to our AnyGantt extension for Qlik Sense, which will further enhance your project data visualization experience. So the current 4th generation of our solution for Gantt charts in Qlik already delivers a whole bunch of new awesome features and improvements — learn about them now in a quick overview.
What’s New in V 4.x of AnyGantt Extension for Qlik Sense
Performance Improvement
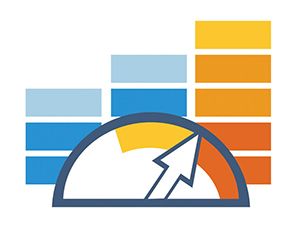
Now you can decide if you want to load data in “Fully expand” mode or not. When the data is not expanded it loads much faster providing a better user experience.
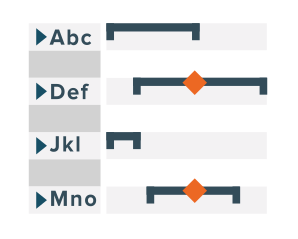
Timeline Zoom Levels Configuration Interface
We’ve developed an amazing interface to configure the timeline zoom levels. Now you can choose which time units can be seen in your timeline and change it easily at any time.
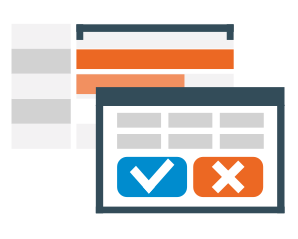
Cascade Coloring of Rows
We’ve introduced two pre-built coloring patterns for rows. One of them is cascade, which implies that each next nesting level is colored lighter than the previous one while staying within the same hue. This is designed to streamline the visual perception of nesting.
Odd-Even Coloring of Rows
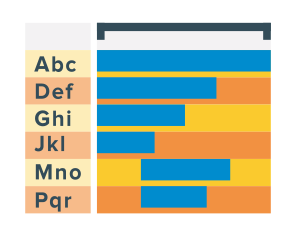
The other newly delivered row coloring pattern can be applied to get odd and even rows colored differently. This style is expected to help data analysts better recognize which row one Gantt chart element or another belongs to.
Expanded/Collapsed by Default
We’ve further extended the default state settings. In particular, you can easily make a Gantt chart appear collapsed down to the top nesting level, facilitating the initial general overview of the project progress or resource allocation.
Connectors
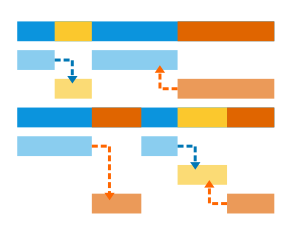
Now it is possible to show dependencies between tasks in a project by means of displaying connectors that link one activity to another.
Export, NPrinting, and Snapshots
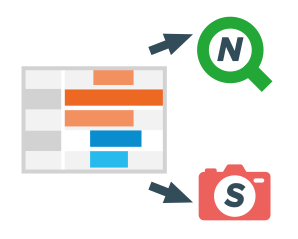
Meet the full-fledged support of exporting to PNG, PDF, and NPrinting as it is already added to our AnyGantt extension for Qlik Sense! Snapshots properly show the state of the Gantt chart: zoomed in/out, expanded/collapsed, etc.
Calculation Condition
You can now specify an expression in a text field to set a condition that needs to be fulfilled (true) for the object to be displayed. The value may be entered as a calculated formula. For example: count(distinct Team)<3. If the condition is not fulfilled, the message or expression entered in Displayed message is shown. A calculation condition is useful when a chart or table is very big and makes the visualization slow to respond. A calculation condition can then help so that for example an object does not show until the user has filtered the data to a more manageable level by applying selections.
Showing Measures as Columns in Resource Chart
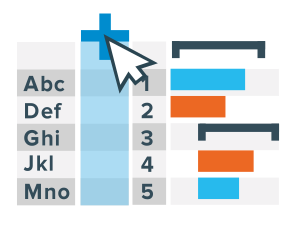
In the new version, we’ve also provided Resource Charts with the capability to visualize measures as columns on the data grid — like in Project Charts. This allows additional information about the elements of a Resource Gantt Chart diagram to be neatly displayed.
Table Header Settings
Table headers can now be stylized to the full extent. In particular, it is possible to customize the background color, font, as well as the text.
Row Numbering
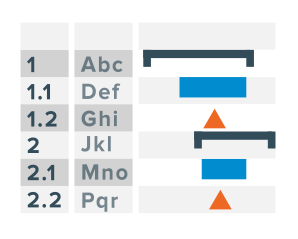
Now you can apply a numbering scheme to the rows in your Gantt Chart. There are currently three options available out of the box: (1) single-level, i.e. consecutive numbering — when all elements are numbered one by one in regular ascending order, e.g. 1, 2, 3, and so on; (2) multi-level, i.e. hierarchical numbering — when top-level elements are numbered 1, 2, 3, and so on, second-level elements are numbered 1.1, 1.2, 1.3, 1.4, and so on, etc.; (3) custom — to be determined using a function.
Label Position Settings
Last but not least, we’ve brought a set of UI controls to facilitate arranging a desired position for labels within or beyond task bars: (1) inside a bar — alignment to the left, center, or right; (2) outside — sticking to the bars’ left or right sides.
Download and Try
Download the latest build to try the new stunning Gantt charting features in action!
How do you like the new AnyGantt extension for Qlik Sense? What else should we add or change? Feel free to share — your feedback largely determines our roadmap. Any questions, just give us a shout.
In case you missed it, last year we partnered with Qlik and launched three extensions for business intelligence experts and data analysts using Qlik Sense. Try them free of charge and schedule a call with us for a personalized demo.