
Sunburst
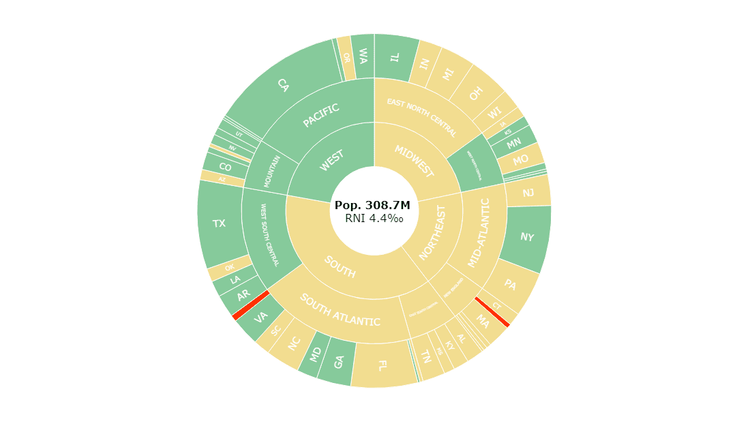
U.S. Demographics (2010 Census)
Get a bird's-eye view of the U.S. population trends revealed by key demographic statistics from the 2010 Census — across states, divisions, and regions. Just at a glance, compare the territories by size of population and recognize where it grows slower than the national average or even declines. Drill down to different levels. Hover over to check the exact counts along with the rates of birth, death, and natural increase.
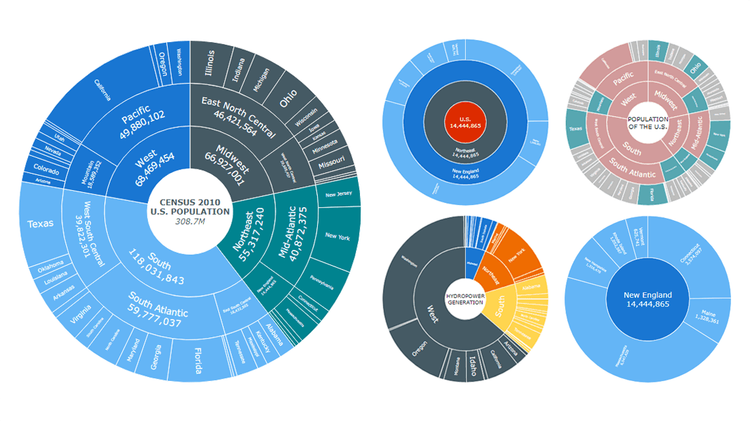
Sunburst Chart Features
Sunburst charts are designed to represent hierarchical data through a set of sliced concentric rings. Looking at a visualization of real U.S. population data from the 2010 Census, explore all major features of our intuitive Sunburst Chart Extension for Qlik Sense. See flexible labels, custom colors, drilldown, center content, HTML tooltips, multiple ways to show the hierarchy and measures, and much more demonstrated in action.
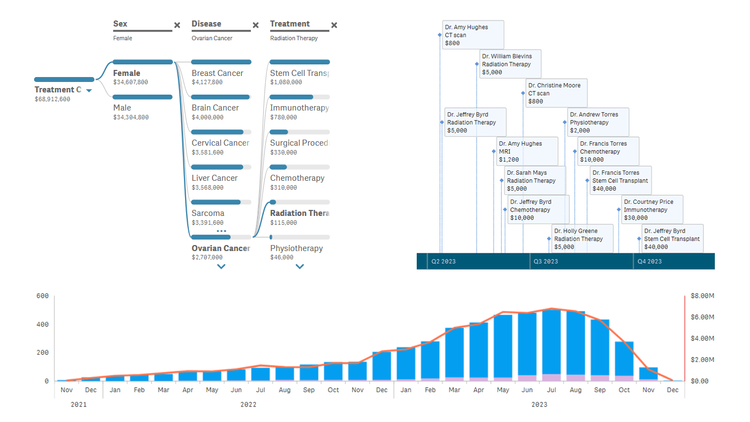
Healthcare Dashboard
Unlock transformative insights in healthcare using Qlik Sense with AnyChart's extensions: Decomposition Tree, Gantt Chart, Combo Chart, Sunburst Chart, and Timeline Chart. Dive deep into metrics like admissions, patient counts, and treatment costs. Perform root cause analysis or ad-hoc explorations with ease. Maintain clear, actionable visibility of doctor-patient timelines and track each patient's journey with insightful precision.
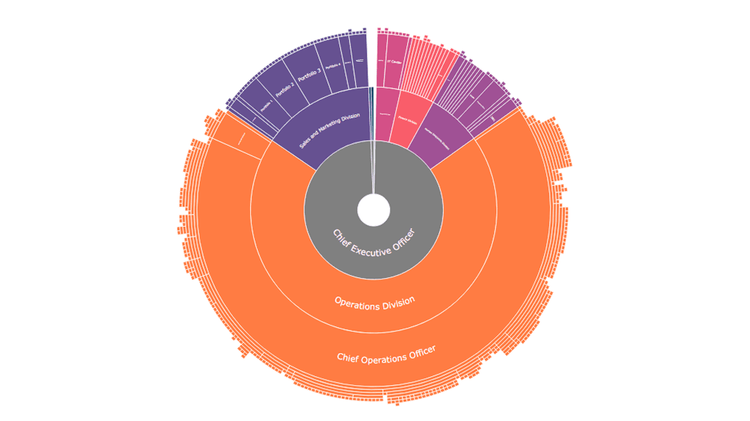
Company Structure
Experience how easily you can explore your company's complete organizational hierarchy with a powerful sunburst chart. This Qlik Sense demo app features one that reveals the structure of a fictional company, including over 800 subdivisions across 12 levels. Navigate and analyze the organizational structure with ease, and drill down to explore specific division levels to gain a deeper understanding of the hierarchy.
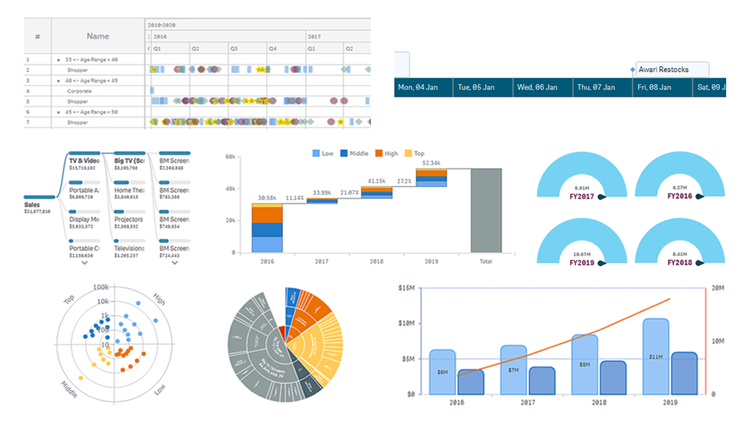
AnyChart Complex Demo
Named best in data analytics and visualization in 2023, AnyChart offers a set of innovative Qlik Sense extensions. Discover the power of the major ones in a quick demo overview and see how they can help you take your visual analytics in Qlik to the next level: Decomposition Tree, Gantt Chart, Combo Chart, Circular Gauge, Bullseye Chart, Sunburst Chart, Timeline Chart, and Waterfall & Advanced Waterfall Chart.