
经典瀑布
度量运算模式
引入了为度量选择运算模式(相加、相减或小计)的功能,以便精确控制每个度量对瀑布图的影响。
箭头标签自定义
为连接柱形的箭头标签添加了文本模板,支持显示数值、百分比或两者。同时增加了自定义箭头标签字体的设置:样式、系列、大小和颜色。
改进:
QLIK-760 — 按表达式着色增强:
- 小计现在可以继承前一数据点的颜色。
- 着色表达式解析为 null 的数据点现在默认显示为灰色。
- 使用按表达式着色模式时,图例现在仅显示自定义项。
QLIK-785 — 其他调整:
- 改进了箭头放置算法。
- 数字格式设置现在也适用于箭头标签。
- 增强的轴刻度设置。
堆叠总计柱
我们扩展了总计柱的显示选项。除了典型的单个实体柱表示和实用的拆分总计功能(允许您将总计柱划分为多个连续柱子)之外,您现在还可以选择带有彩色或非彩色子柱的堆叠柱。这一新增功能增强了子类别对总计贡献的评估,与现有选项相辅相成,让您能够完全控制瀑布图中总计的视觉呈现。
改进:
- 更新了属性面板中元素的命名,以提高可读性和导航体验。
Bug 修复:
- 移除了 X 轴上类别名称中的下划线。
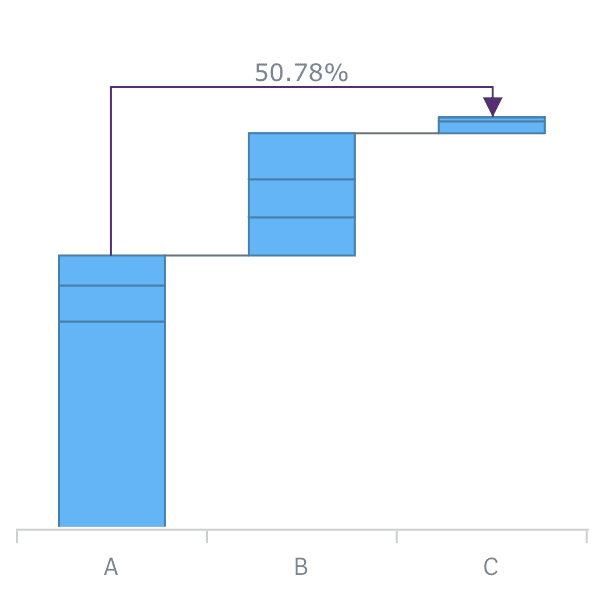
跨类别连接线
AnyChart Waterfall extensions now allow you to add Cross-category Arrow Connectors that can show the percentage or absolute value difference between any two categories
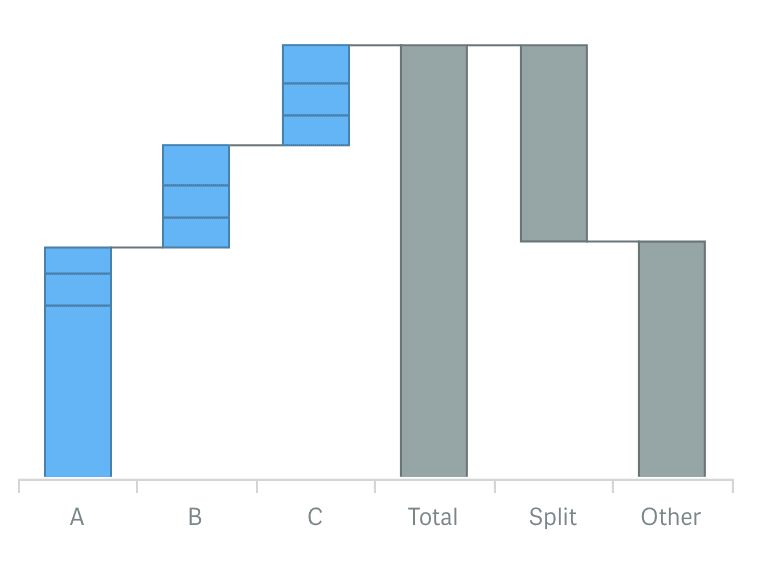
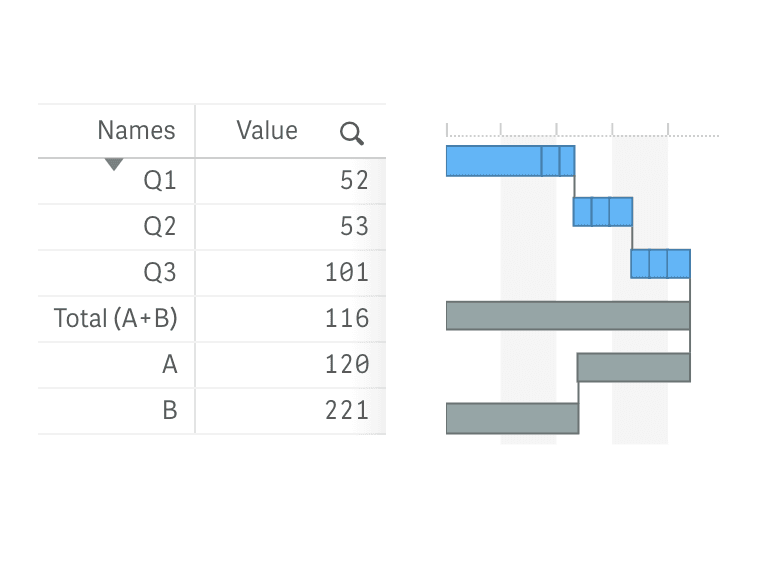
拆分总计显示
Now you can use a split display of the total category to provide for context and clear view of the elements total value consists of.
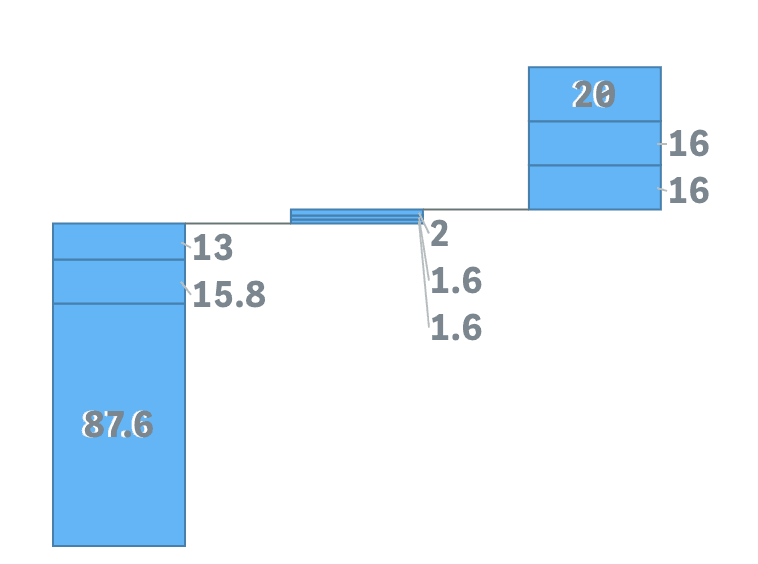
外部标签布局与阈值模数设置
Stacked AnyChart Waterfall Extension for Qlik Sense now has a special option for small values in stacks: labels can be displayed right beside the stack or hidden if values defined by a certain threshold are irrelevant to the analysis.
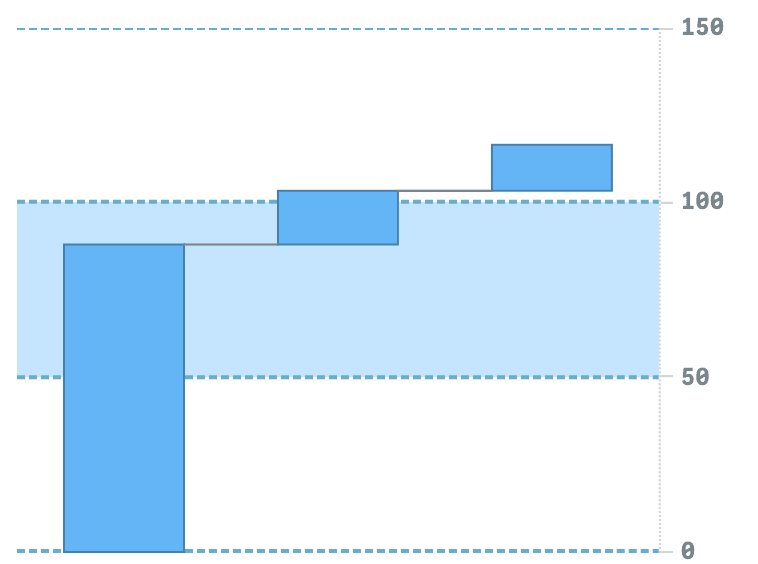
轴和网格设置
Waterfall charts now have extended axes and grid settings giving you an option to give charts a more appealing and informative look.
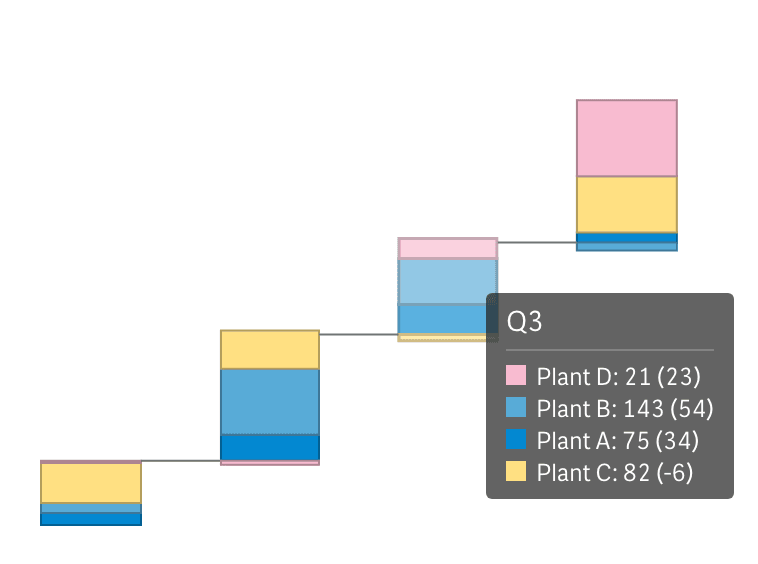
子类别堆叠的联合提示框
Stacked Waterfall charts now have an option to show one tooltip for a stack instead of separate, allowing users to see all information about elements accompanied by proper color legend.
垂直布局
All Waterfall charts can now be shown vertically, allowing you to place them against a table and provide information in more telling context.
改进:
- QLIK-409 — 堆叠标签现在可以显示绝对值和相对值。
- QLIK-414 — 小计轴标签现在可以使用表达式和变量进行设置。
- QLIK-294 — 维度和度量现在可以使用计算条件。
Improvements:
- Migrated to unified About panel with updated branding and license display.
- Minor internal improvements.