
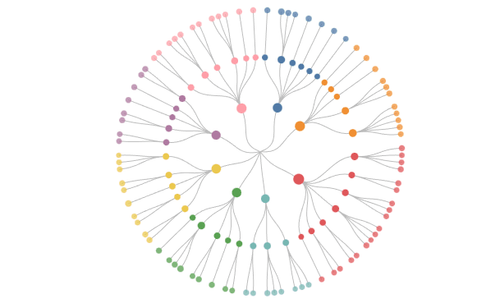
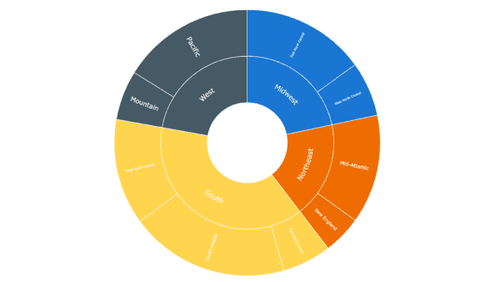
Bring the at-a-glance readability of a hierarchical tree into Qlik Sense with a fully interactive radial dendrogram embedded directly in your dashboards.
Delivers colour-coded branches, value-driven leaf sizing, and cross-filter breadcrumbs tied to live Qlik data so users can scan, drill, and analyze nested categories without leaving the chart.
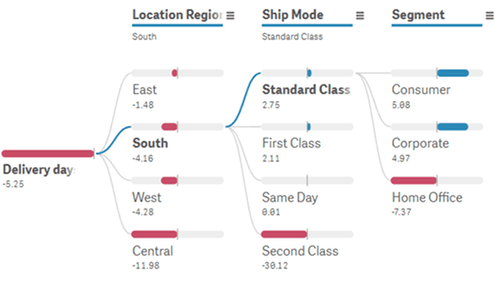
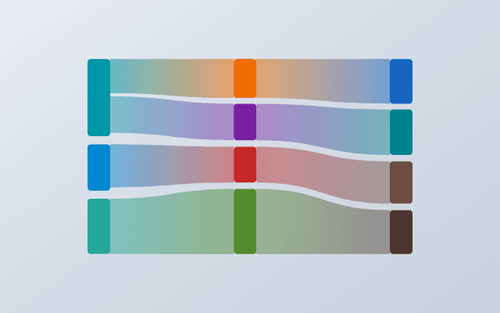
The Sankey Diagram extension for Qlik Sense visualizes how values flow between categories across multiple stages — from source to destination, through any number of levels.
Instantly reveals where the largest transfers occur in budgets, supply chains, customer journeys, or any multi-step process, with interactive selections that filter your entire Qlik model in a single click.