Qlik Connect with AnyChart
Booth #807 at Qlik Connect
Rosen Shingle Creek, Orlando, FL
June 3–5, 2024
Qlik Connect 2024 is now complete.
Qlik Connect Global Event Comes to Orlando
Qlik Connect 2024, formerly known as QlikWorld, brought together Qlik's customers, partners, and product experts from around the world. This year's theme, Where data meets opportunity, set the stage for a deep dive into the latest in data integration, quality, governance, analytics, and AI/ML. Attendees engaged with keynote speakers, participated in interactive sessions with industry leaders, heard inspiring customer success stories, and got hands-on technical training.
As an Emerald sponsor, AnyChart showcased our latest developments for Qlik Sense at Booth #807. Our team demonstrated how our extensions — like the Decomposition Tree, Gantt Chart, and Sunburst Chart — enable faster, more insightful decisions that maximize data value.
Join us at Booth #1007 at Qlik Connect 2025 to see what's new — including our brand-new Spreadsheets extension!
Upgrade Your Data Analytics with Unique Visualizations
In 2024, AnyChart was awarded for Best Innovation in Data Analytics & Visualization. Come find out how our advanced charting solutions can make your dashboards more insightful and effective — all using our extensions for Qlik Sense.

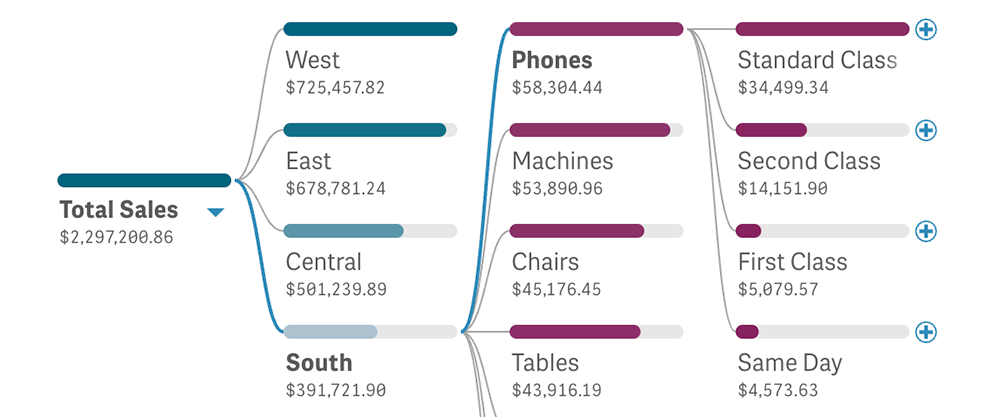
Decomposition Tree
Elevate your dashboards with our Decomposition Tree for Qlik Sense, designed to facilitate deep analytical insights.
Originally popularized by Power BI, this unique visualization adeptly breaks down complex metrics into their contributing factors, streamlining the discovery of key drivers and bottlenecks.
Ideal for comprehensive root cause analysis and dynamic ad-hoc data drilling, decomposition trees help business users and analysts easily navigate multi-dimensional data with clarity and precision.
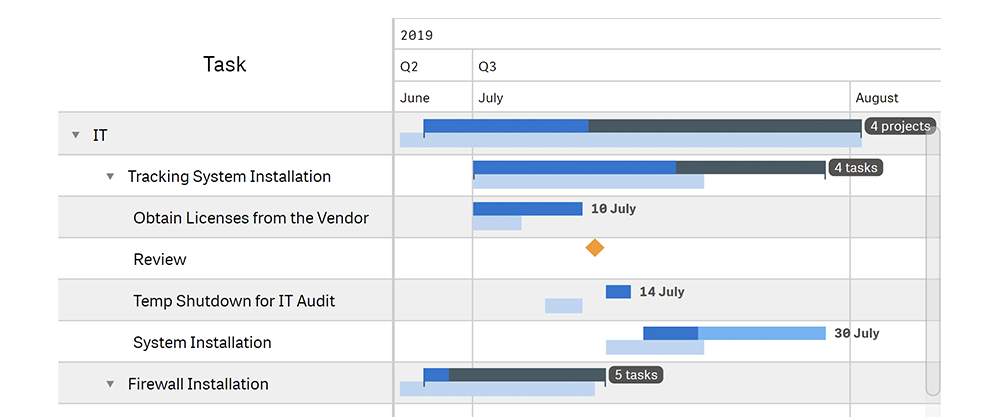
Gantt Chart
Simplify project management with our Gantt Chart for Qlik Sense, tailored to enhance planning, scheduling, and progress tracking.
It enables the intuitive construction of detailed project activity timelines, neatly organizing tasks, milestones, and dependencies to provide as much detail as needed for actionable insights.
We also offer a specialized Gantt Chart extension for streamlining resource allocation and management.
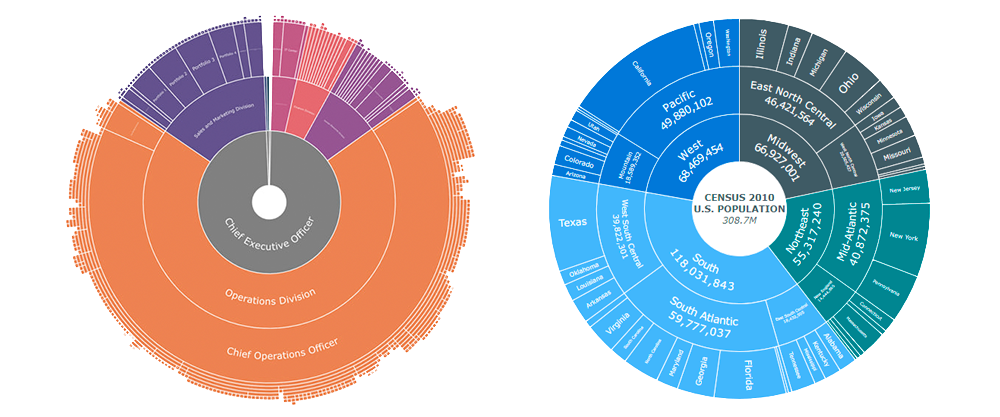
Sunburst Chart
Unleash hierarchical insights with our Sunburst Chart for Qlik Sense.
This compelling visualization displays data through concentric circles, allowing users to understand proportional relationships between different layers at a glance.
Perfect for displaying nested data in a clear and accessible format, sunburst charts help identify trends and patterns across multiple levels, making them invaluable for detailed data exploration.
Reserve Your Spot at Qlik Connect 2024
Qlik Connect 2024 is now complete.AnyChart has been developing visual data tools for over 20 years!
Our products have received a lot of recognition and awards from data visualization and software industry experts.