

In the evolving data landscape, the pivot table has long been a cornerstone of the data analyst’s toolkit. Traditionally used to summarize datasets in a condensed tabular form, pivot tables facilitate quick overviews and basic drill-down capabilities. However, as data sets grow larger and more complex, the static and manual nature of pivot tables can limit their effectiveness.
Enter the decomposition tree, an advanced data visualization technique that not only presents data but also uncovers deeper patterns and insights ad hoc, all through its dynamic, interactive hierarchical structure. As a relatively new tool in the realm of data analysis and business intelligence, it is increasingly used as an effective alternative to a pivot table yet still often underrated, given its inherent potential.
This article explores several reasons why decomposition trees can be advantageous over traditional pivot tables, illustrated with real-world use cases.
Understanding the Basics
Before we dive in, let’s define the pivot table and the decomposition tree, overviewing their absolute basic traits and features.
What Is Pivot Table?
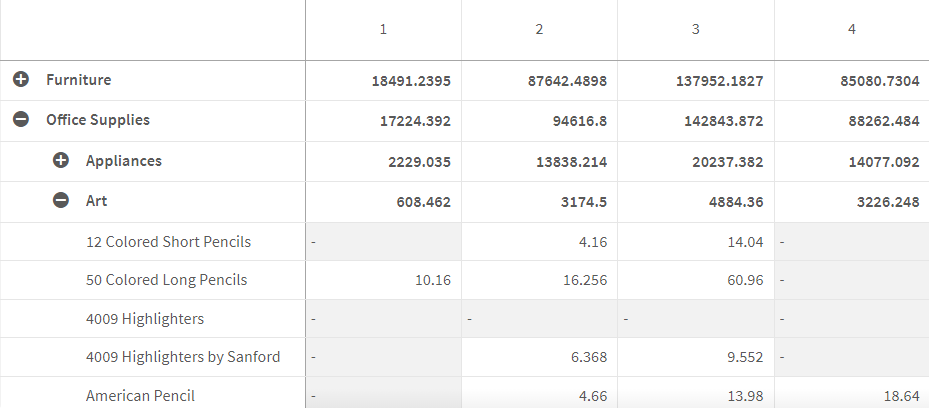
A pivot table is a statistical tool that summarizes and reorganizes selected columns and rows of data in a spreadsheet or database to obtain desired reporting in tabular form. It allows users to perform basic sorting, counting, and total summarization of pivots.
Pivot tables are primarily used to aggregate data, making them essential for quick summaries and straightforward reports. They excel in situations where the analysis dimensions are known beforehand and do not require alteration.
What Is Decomposition Tree?
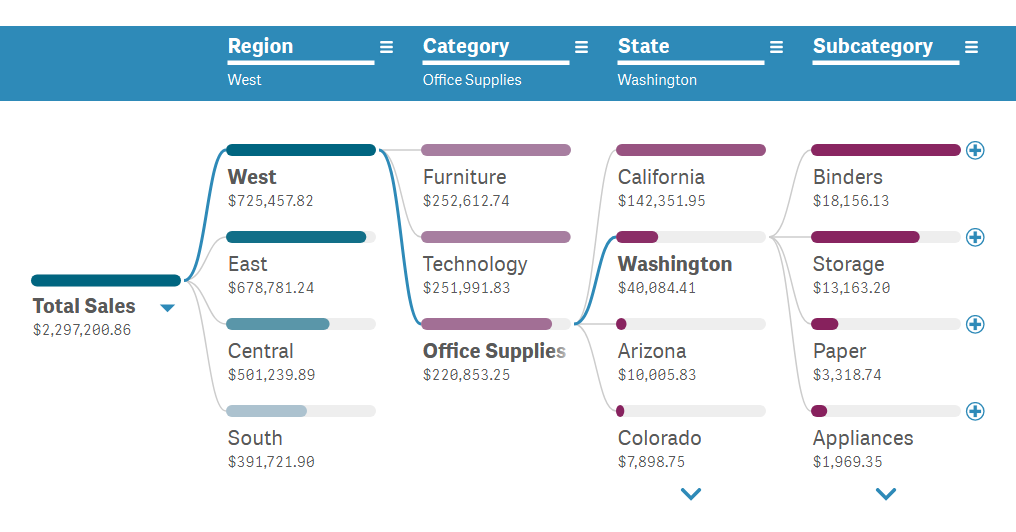
A decomposition tree is a visual analysis tool used to explore data hierarchically in a dynamic manner. It allows analysts to start with a high-level overview and drill down into various branches to explore multiple paths of interest. Such a tree structure dynamically adjusts as users explore the data, providing a tailored analytical path based on the user’s choices that suggests potential areas of interest as it reacts in real-time to the analyst's hypotheses and discoveries.
This visualization clearly aids in understanding the contributions of different factors at various levels, enabling intuitive root cause analysis and enhancing the ability to track and analyze the flow of data ad hoc, all to uncover specific actionable insights quickly.
Advantages of Decomposition Trees Over Pivot Tables
1. Clear Hierarchical Insights
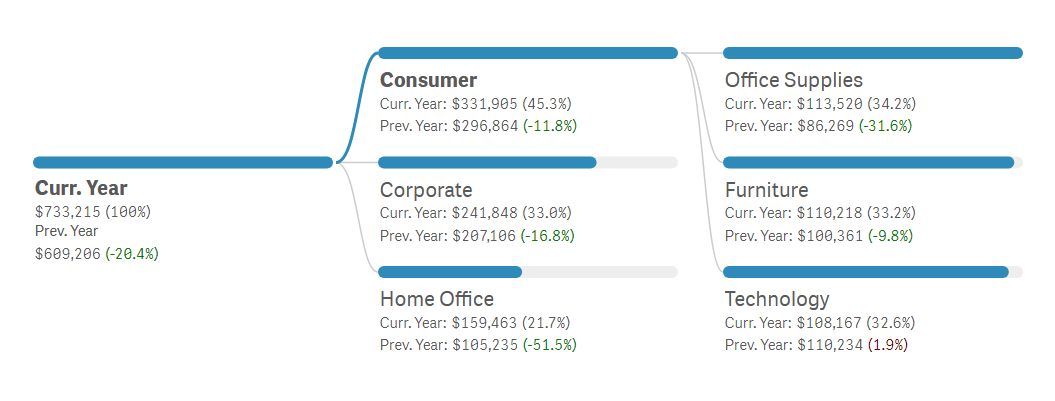
Decomposition trees excel in breaking down data hierarchically, allowing for a visual and intuitive understanding of how different factors contribute at various levels. This capability is particularly advantageous over pivot tables, which typically present data in a flat, tabular form.
In a pivot table, understanding the relationship between different levels can be challenging and often requires additional data manipulation. Decomposition trees simplify this process by visually displaying the data structure, making it easier for users to perceive the impacts and interactions at each level of the data hierarchy.
For example, a financial analyst examining expense data can use a decomposition tree to visually trace how broad categories like administrative costs break down into finer details such as office supplies, utilities, and staffing. This hierarchical breakdown helps pinpoint areas where cost reductions could be most effective, a task that would be less straightforward and more time-consuming with a pivot table.
2. Dynamic Ad-Hoc Exploration

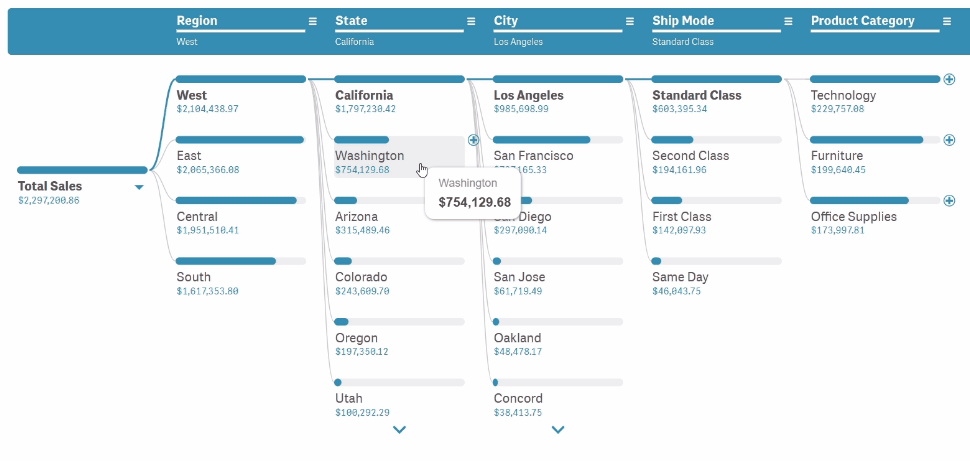
Decomposition trees provide dynamic exploration capabilities, allowing users to interactively expand and collapse nodes to delve into different levels of data granularity. This flexibility stands in stark contrast to pivot tables, which require a predefined structure that often necessitates reconfiguration of the entire table to explore new aspects of the data. Decomposition trees make it significantly easier to navigate through the data and adjust the focus of analysis spontaneously based on findings that emerge as one drills down into the data.
In practice, a marketing analyst could use a decomposition tree to dynamically explore customer segmentation data. Starting with a general view of customer demographics, the analyst can drill down into specific segments to analyze purchasing patterns or campaign responses without the need to predefine these pathways, as would be necessary with a pivot table.
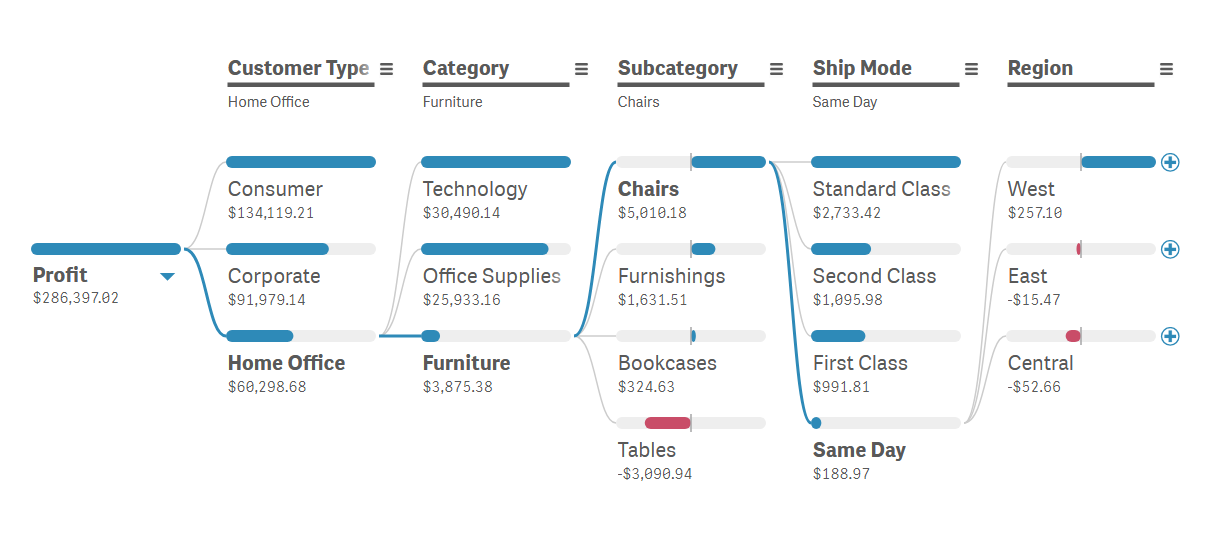
3. Focus on Path Analysis
Decomposition trees are particularly suited for path analysis, offering insights into the sequences or chains of contributions leading to specific outcomes. This is less feasible with pivot tables, which are more oriented towards cross-sectional analysis that provides snapshots rather than dynamic pathways. Decomposition trees allow analysts to trace step-by-step contributions, which is invaluable for processes like diagnosing production issues or optimizing user flow on a website.
For instance, an operations manager might use a decomposition tree to identify bottlenecks in a manufacturing process. By following the sequence of production stages, the manager can pinpoint exactly where delays are occurring and the factors contributing to those delays — insights that are critical for process improvement.
4. Intuitive Ease of Use

For those who are more visually oriented, decomposition trees offer a more intuitive and engaging way to analyze data. The graphical representation of data helps in quickly identifying trends, patterns, and outliers, which might be less apparent and require more effort to discern in a pivot table’s raw numbers view. This visual approach not only enhances the user experience but also speeds up the process of analysis by making information more accessible.
Picture this: a user experience designer might find decomposition trees particularly useful for analyzing visitors’ paths through a website or application. The tree structure can visually represent how users navigate through different screens or features, highlighting common pathways and potential points of user drop-off.
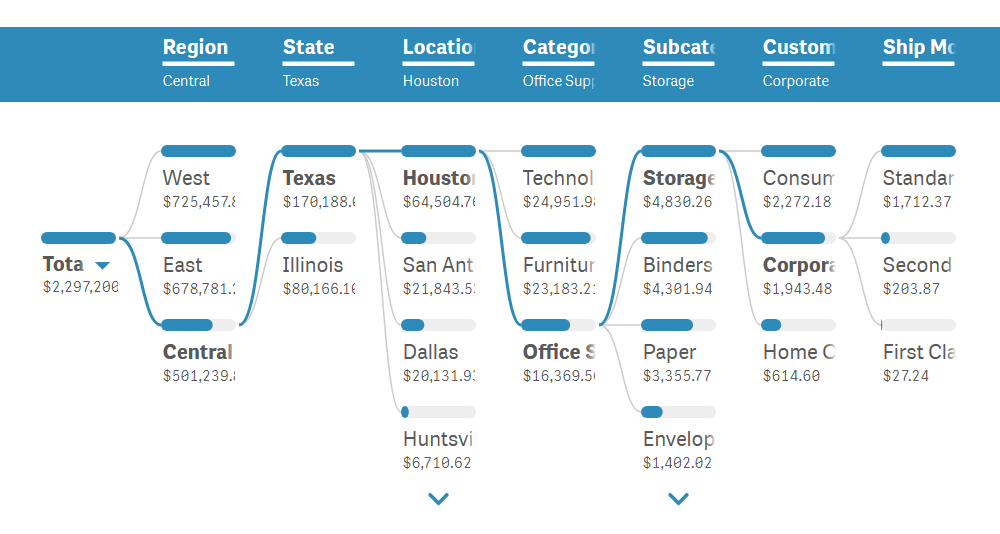
5. Customizable Detail Levels
With decomposition trees, analysts have the flexibility to choose how much detail to view at any given point in their analysis. This customizability helps manage cognitive load by focusing only on relevant data points at the right time, in contrast to pivots in tables, which often present all data simultaneously, potentially leading to information overload. Additional information can be conveniently displayed beneath the nodes or within the tooltip when needed.
In a healthcare data analysis scenario, a medical researcher could use a decomposition tree to study the effects of various treatments on patient outcomes. By adjusting the level of detail, the researcher can focus on broad treatment categories or delve into specific patient responses, tailoring the analysis to the current research questions without overwhelming detail.
6. Optimal for Big Data Sets
Decomposition trees are particularly adept at handling large data sets by allowing users to selectively expand data nodes. This approach prevents the user from being overwhelmed by massive amounts of information at once, a common issue with complex pivot tables that attempt to display large data sets in their entirety. This selective expansion makes decomposition trees not only more efficient but also more user-friendly when dealing with substantial data.
For example, a data analyst at a large retail chain could use a decomposition tree to manage and analyze sales data across hundreds of stores. By selectively expanding nodes related to specific regions, store types, or time periods, the analyst can effectively manage the large data volume, focusing on analyzing trends and anomalies where they matter most.
Wrapping Up Superiority of Decomposition Trees Over Pivot Tables in Modern Data Analysis
Decomposition trees offer a compelling alternative to pivot tables by providing enhanced hierarchical visualization, dynamic exploration capabilities, focused path analysis, customizable detail levels, and superior handling of large data sets. These features make decomposition trees particularly suited for today’s analytical challenges, where data complexity and volume demand more than what static, tabular representations can offer.
Integrating and building upon traditional data analysis methods, decomposition trees not only enable deeper insights but also facilitate more strategic decision-making across various domains. This advantage is crucial in environments where decisions must be informed by a comprehensive understanding of complex data interactions. Through their ability to dynamically adjust and drill down into specific data points, decomposition trees empower analysts to make informed, timely decisions that are backed by a robust analysis of the underlying data, greatly enhancing the decision-making process over what pivot tables can provide.
While pivot tables are widely used across various platforms such as Microsoft Excel, Google Sheets, and Tableau, decomposition trees are a specialized tool primarily available in advanced BI and analytics software like Power BI and Qlik Sense — enriched with AI Splits for automated root cause insights. Look for an option to build a decomposition tree in your suite and give it a try to witness its transformative power firsthand. Should you ever need that traditional way of data drilling, you can still create a pivot table in both Qlik Sense (learn more) and Power BI (here’s how).