
クラシックウォーターフォール
メジャーの演算モード
メジャーの演算モード(加算、減算、または小計)を選択できる機能を導入し、各メジャーがウォーターフォールチャートにどのように寄与するかを正確に制御できるようになりました。
矢印ラベルのカスタマイズ
列をつなぐ矢印のラベルにテキストテンプレートを追加し、値、パーセンテージ、またはその両方を表示できるようになりました。また、矢印ラベルのフォント(スタイル、ファミリー、サイズ、色)をカスタマイズする設定も追加しました。
改善点:
QLIK-760 — 数式による色分けの機能強化:
- 小計が前のデータポイントから色を継承できるようになりました。
- 色の数式の結果がnullになるデータポイントは、デフォルトでグレー表示されるようになりました。
- 数式による色分けモードを使用している場合、凡例にはカスタム項目のみが表示されるようになりました。
QLIK-785 — その他の調整:
- 矢印の配置アルゴリズムを改善しました。
- 数値の書式設定が矢印ラベルにも適用されるようになりました。
- 軸の目盛り設定を強化しました。
積み上げ合計バー
合計バーの表示オプションを拡張しました。一般的な単一の塗りつぶしバー表示や便利な Split Total 機能(合計バーを複数の連続するバーに分割可能)に加え、色付きまたは色なしのサブバーによる積み上げバーを選択できるようになりました。この追加により、合計に対するサブカテゴリの寄与の評価が容易になり、既存のオプションを補完してウォーターフォールチャートにおける合計の視覚化を完全にコントロールできるようになります。
改善点:
- 視認性とナビゲーションを向上させるため、プロパティパネルの要素の命名を更新しました。
バグ修正:
- X軸のカテゴリ名からアンダースコアを削除しました。
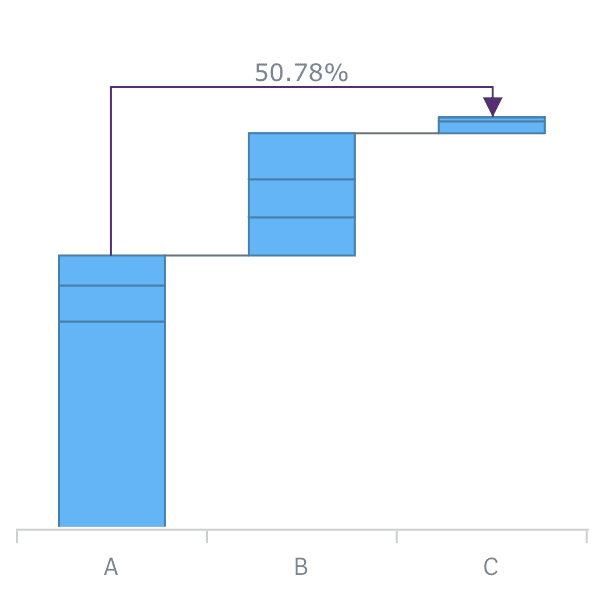
カテゴリ間コネクタ
AnyChart Waterfall extensions now allow you to add Cross-category Arrow Connectors that can show the percentage or absolute value difference between any two categories
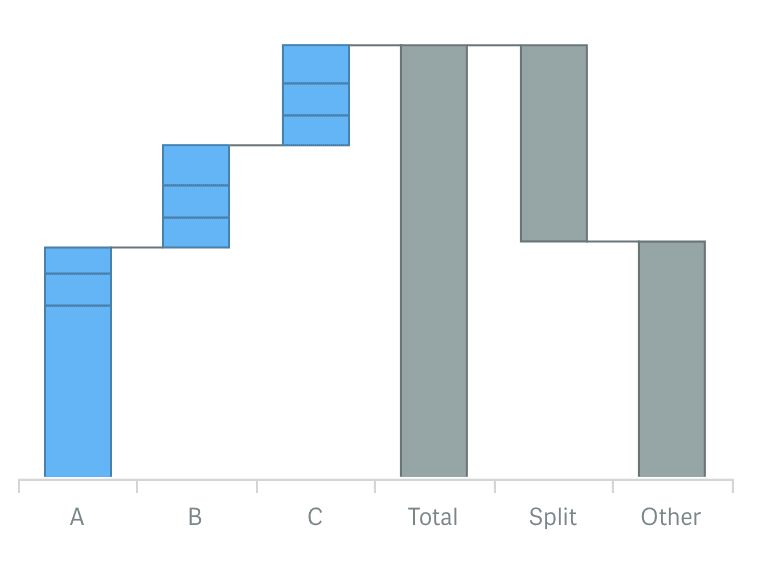
分割合計表示
Now you can use a split display of the total category to provide for context and clear view of the elements total value consists of.
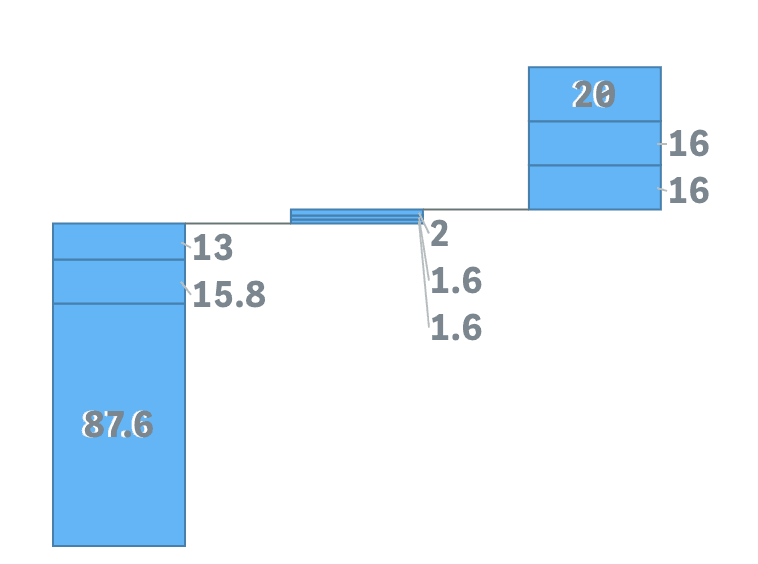
外部ラベルの配置としきい値の係数設定
Stacked AnyChart Waterfall Extension for Qlik Sense now has a special option for small values in stacks: labels can be displayed right beside the stack or hidden if values defined by a certain threshold are irrelevant to the analysis.
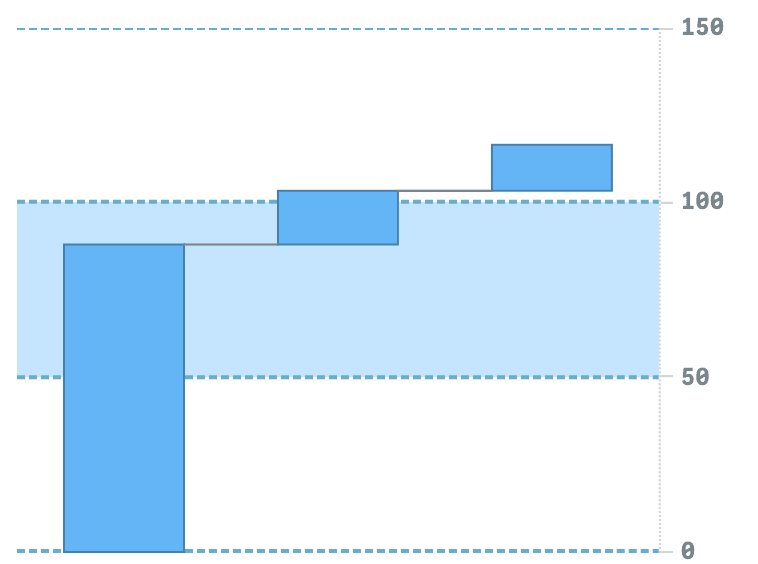
軸とグリッドの設定
Waterfall charts now have extended axes and grid settings giving you an option to give charts a more appealing and informative look.
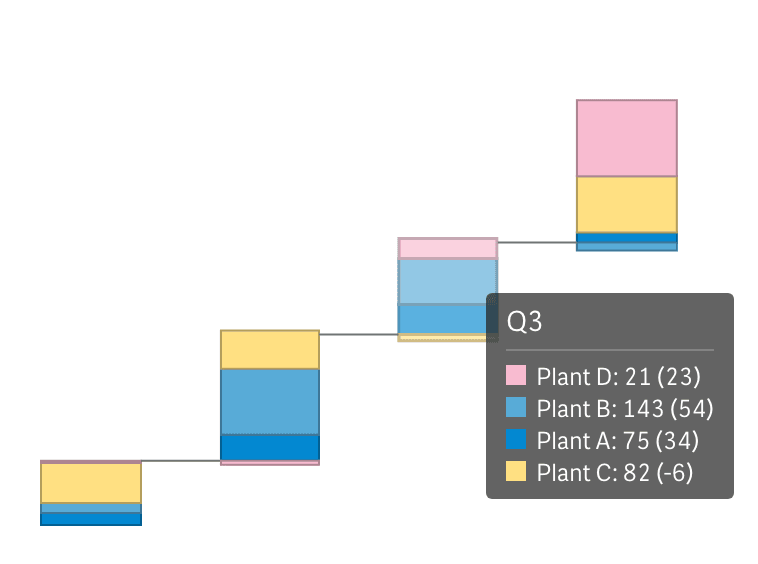
サブカテゴリの積み上げ用結合ツールチップ
Stacked Waterfall charts now have an option to show one tooltip for a stack instead of separate, allowing users to see all information about elements accompanied by proper color legend.
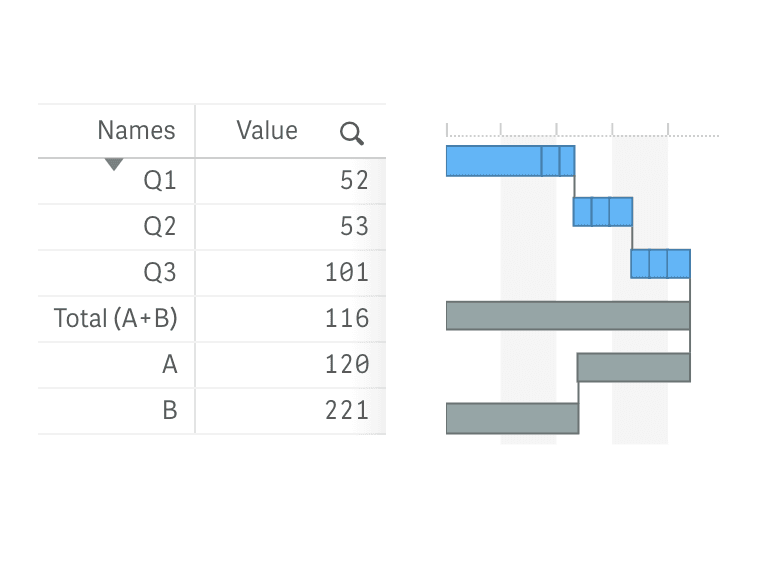
垂直レイアウト
All Waterfall charts can now be shown vertically, allowing you to place them against a table and provide information in more telling context.
改善点:
- QLIK-409 — 積み上げラベルで絶対値と相対値を表示できるようになりました。
- QLIK-414 — 小計の軸ラベルを数式や変数で設定できるようになりました。
- QLIK-294 — 軸とメジャーで計算条件が利用可能になりました。
Improvements:
- Migrated to unified About panel with updated branding and license display.
- Minor internal improvements.