
Decomposition Tree
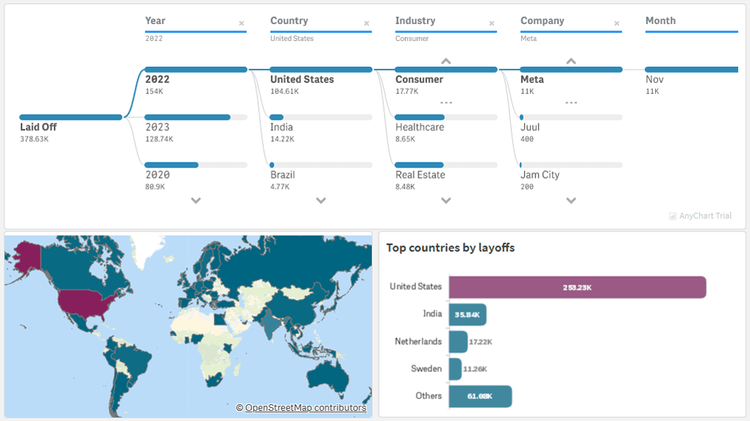
Tech Layoffs
Explore layoffs in the technology sector worldwide since the COVID-19 pandemic with data from Layoffs.fyi. Using the decomposition tree and combo chart visualizations in this Qlik Sense app, identify which countries, industries, and companies have experienced the most job cuts and when they occurred. Compare the number of layoffs with funds raised and gain other insights into tech layoff statistics over the past few years.
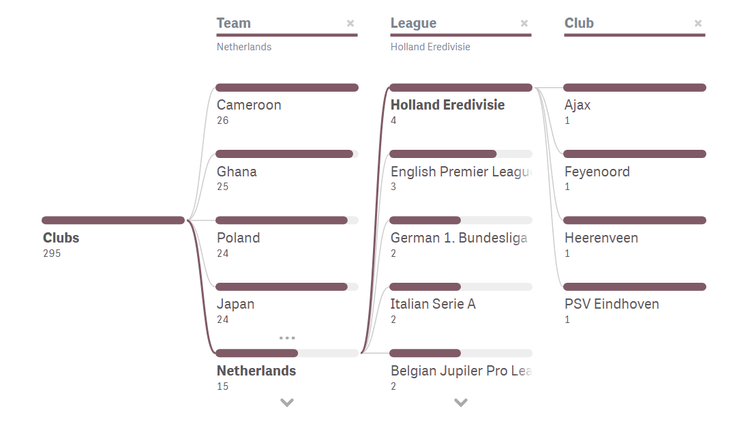
FIFA World Cup Qatar 2022 Teams
Investigate how the national football/soccer teams of all 32 participating countries in the 2022 Qatar World Cup are made up of players from various leagues and clubs, using remarkable Decomposition Tree visualizations in Qlik Sense. (Re)arrange the order of the represented dimensions depending on how you want to disaggregate the totals. Analyze goals and caps for national teams similarly using intuitive decomposition trees.
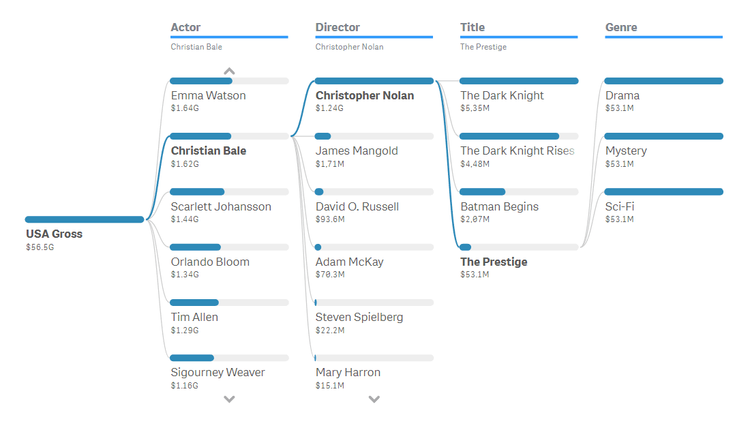
IMDb Top 1000 Movies
Dig into the top 1000 movies of all time according to IMDb, an online database claiming to be the world's most popular source for movie content. Identify the top actors and quickly learn which directors, genres, years, and individual films contributed the most to their success. Switch these dimensions as you like to explore the top directors, years, movies, or genres in the same innovative fashion powered by decomposition trees in Qlik Sense.
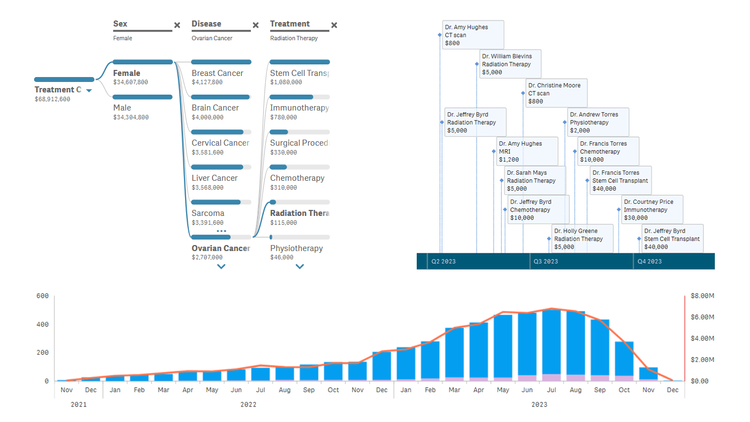
Healthcare Dashboard
Unlock transformative insights in healthcare using Qlik Sense with AnyChart's extensions: Decomposition Tree, Gantt Chart, Combo Chart, Sunburst Chart, and Timeline Chart. Dive deep into metrics like admissions, patient counts, and treatment costs. Perform root cause analysis or ad-hoc explorations with ease. Maintain clear, actionable visibility of doctor-patient timelines and track each patient's journey with insightful precision.
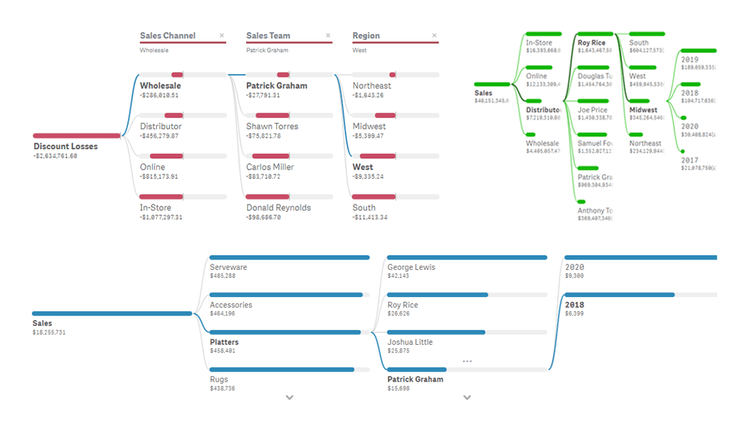
Decomposition Tree Features — Now with AI Splits!
Discover the decomposition tree in Qlik Sense! This chart efficiently visualizes data across multiple dimensions, allowing easy disaggregation and drill-down into dimensions in any order to uncover what makes up a value. Explore <a href="https://qlik.anychart.com/news/ai-splits-qlik-sense/">AI Splits</a>, providing automated root cause insights, and other major features of our intuitive Decomposition Tree Extension for Qlik Sense — see multiple measures, conditional coloring, percentage analysis, paging, and much more demonstrated in action.
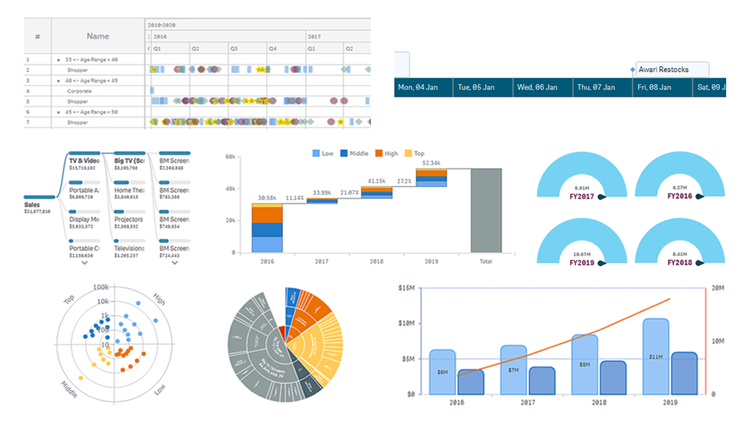
AnyChart Complex Demo
Named best in data analytics and visualization in 2023, AnyChart offers a set of innovative Qlik Sense extensions. Discover the power of the major ones in a quick demo overview and see how they can help you take your visual analytics in Qlik to the next level: Decomposition Tree, Gantt Chart, Combo Chart, Circular Gauge, Bullseye Chart, Sunburst Chart, Timeline Chart, and Waterfall & Advanced Waterfall Chart.
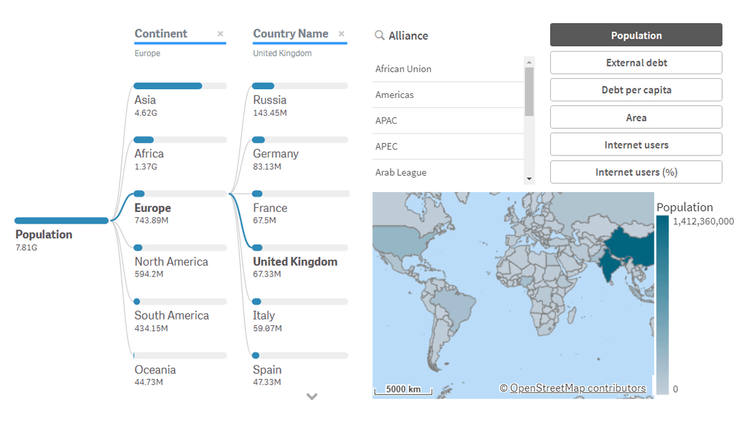
Global Country Insights
Explore countries, alliances, and continents with our powerful Decomposition Tree in Qlik Sense, which brilliantly represents data across multiple dimensions and enables effortless ad hoc analysis. View some statistics for each country: population, area, debt, internet usage, and more. Use the intuitive interface to seamlessly navigate by continent or alliance (APEC, NATO, etc.). Discover the full potential of Decomposition Tree for making complex data actionable!
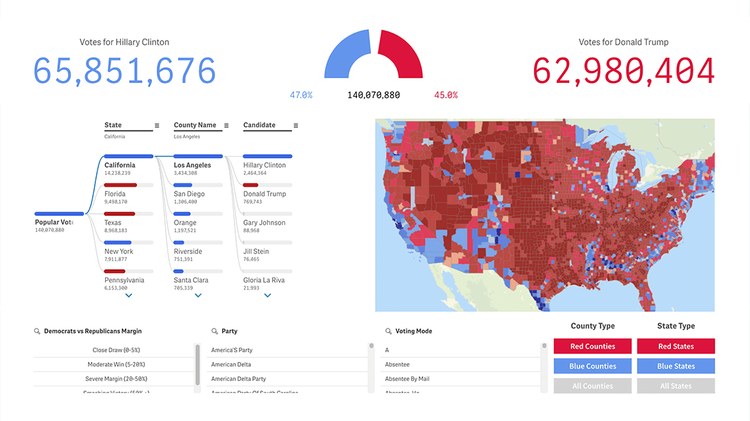
U.S. Presidential Elections
Gain a deep understanding of U.S. presidential election dynamics. Analyze the results of the elections through interactive visualizations, including maps, decomposition trees with AI Splits, circular gauges, and more. Dive into popular and electoral vote data at national, state, and county levels. Explore swing state impacts, third-party influence, and even fictional write-ins — from Daenerys Targaryen to Donald Duck. Discover trends, margins, and patterns that shaped America's choice — with plans to expand all the way back to George Washington.