
TV Shows (Resource Gantt Multiple Milestones)
This Qlik Sense demo app uses Gantt Resource Charts with multiple milestones to visualize TV show popularity. Enjoy Qlik analytics with AnyChart extensions!
TV Shows (Resource Gantt Multiple Milestones)


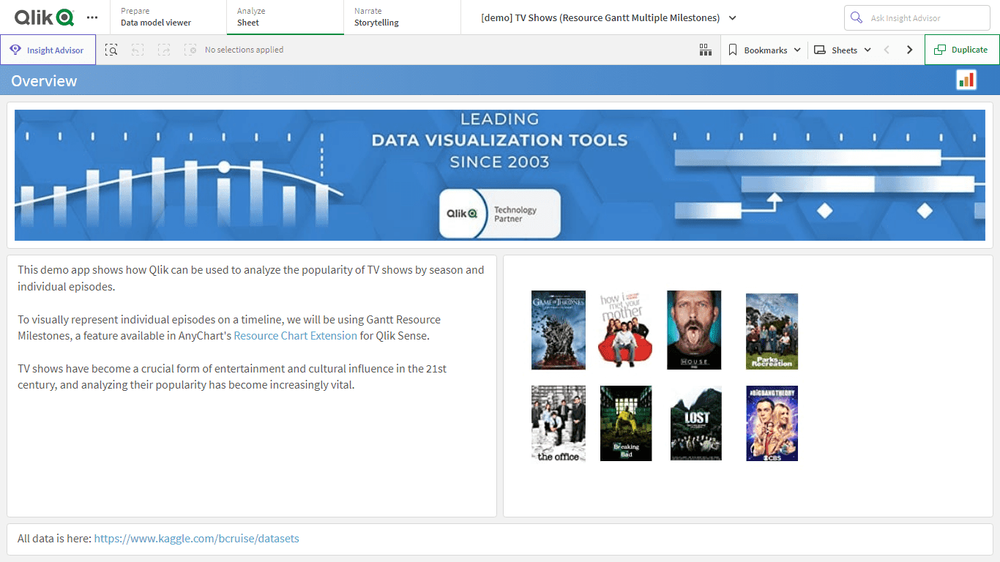

About this app
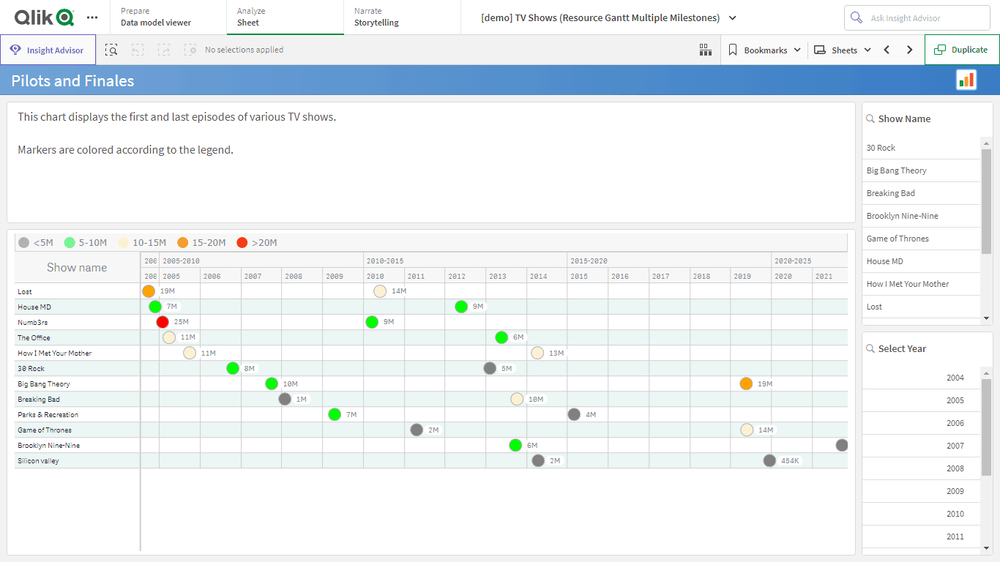
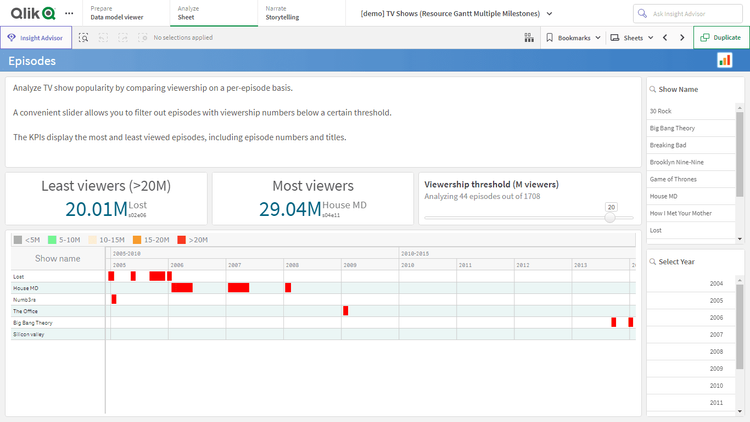
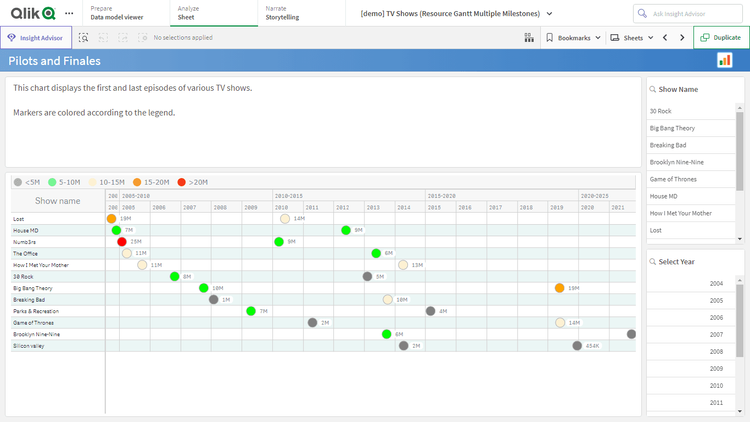
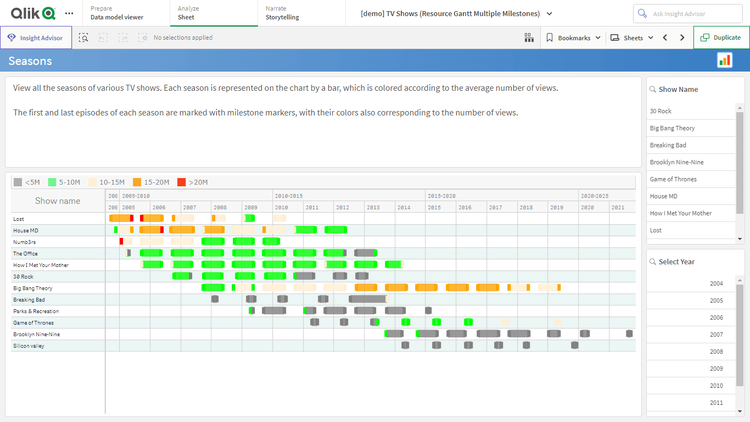
Analyze the popularity of various TV shows by season and episode — with our Resource Gantt charts for Qlik Sense and the feature of multiple milestones in a single line in action. Compare viewership on a per-episode basis and identify the most and least viewed episodes. Examine the first and last episodes. Get an overview of all seasons with color-coded bars based on the number of views.
This application features Resource Gantt Chart visualizations built with the Resource Chart extension for Qlik Sense. The data is taken from Bill Cruise’s datasets on Kaggle.