
Programas de TV (Gantt de recursos con múltiples hitos)
Esta demo de Qlik Sense usa gráficos de Gantt de recursos con múltiples hitos para visualizar la popularidad de programas de TV. Analiza con AnyChart.
Programas de TV (Gantt de recursos con múltiples hitos)


Acerca de esta aplicación
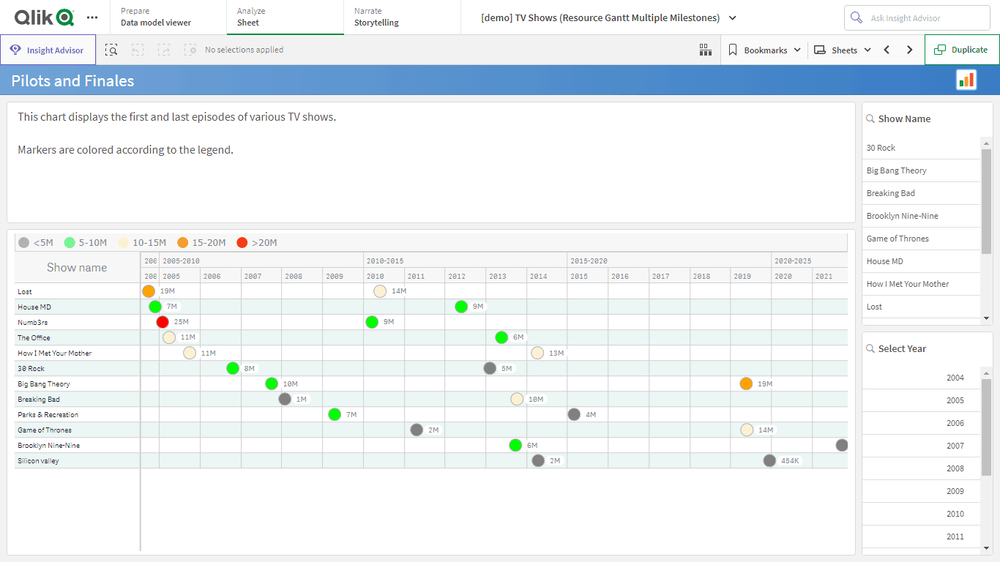
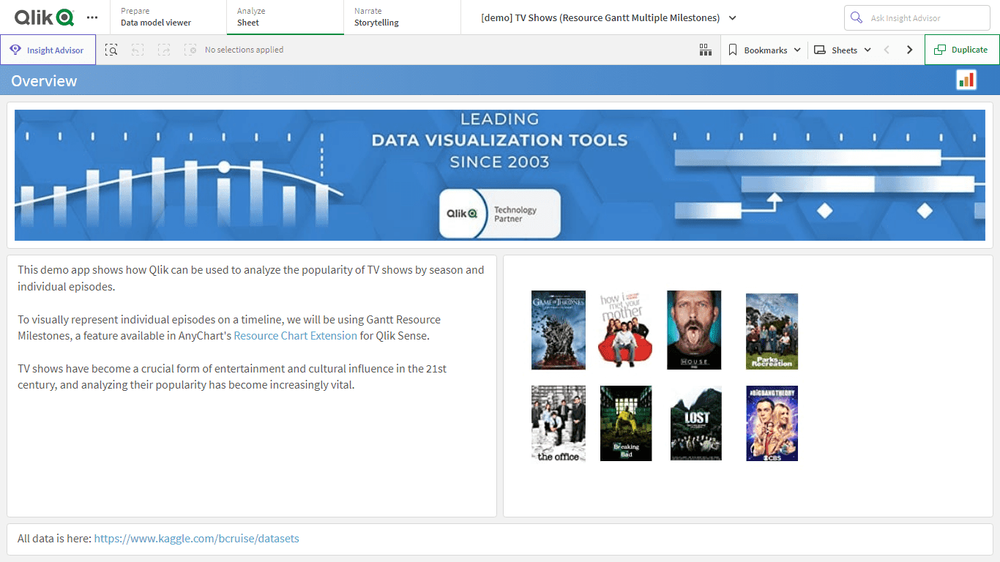
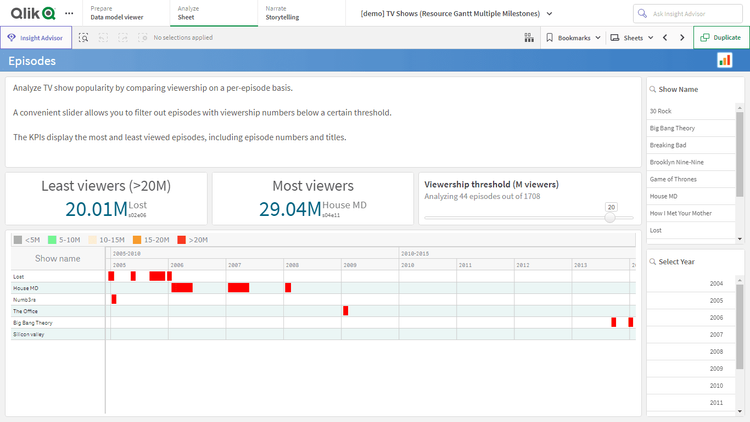
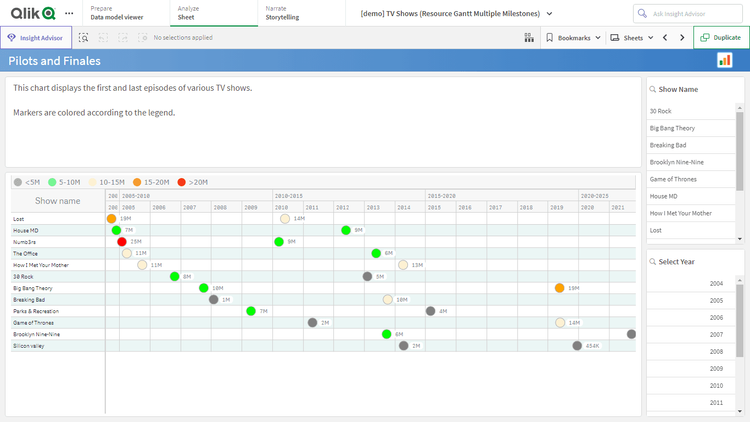
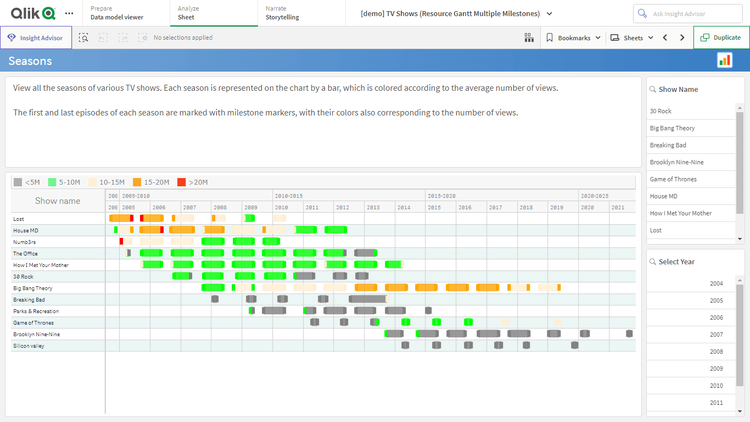
Analiza la popularidad de distintos programas de TV por temporada y episodio con nuestros gráficos de Gantt de recursos para Qlik Sense y la función de múltiples hitos en una sola línea en acción. Compara la audiencia de cada episodio e identifica los más y menos vistos. Examina los primeros y últimos episodios. Obtén una visión general de todas las temporadas con barras codificadas por color según el número de visualizaciones.
Esta aplicación presenta gráficos de recursos creados con la extensión AnyGantt para Qlik Sense. Los datos provienen de los conjuntos de datos de Bill Cruise en Kaggle.