AnyGantt 项目管理捆绑包
适用于 Qlik Sense 的最佳 Gantt、Resource 和 Timeline 扩展包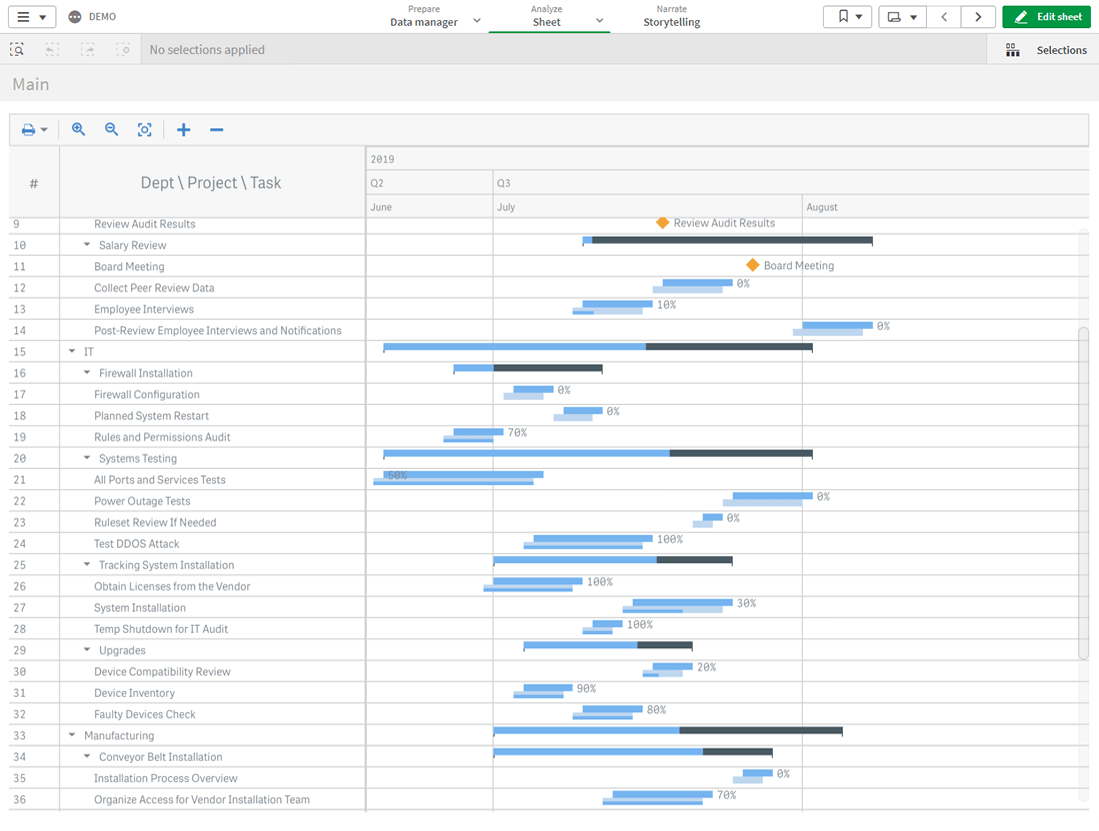
AnyGantt 是 Qlik Sense 唯一将项目管理、资源规划和 Timeline 工作流程整合在一起的解决方案。确保项目按计划进行,保持在预算范围内,管理资源并降低风险。
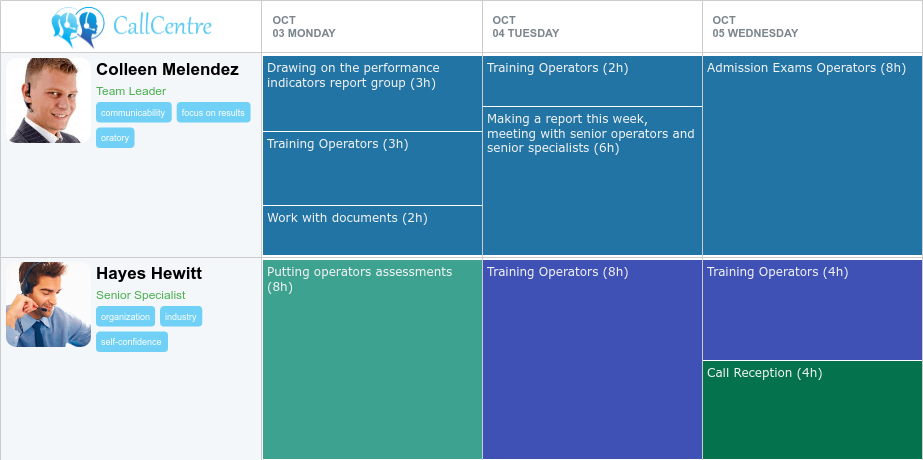
该捆绑包包含 Gantt、Resource 和 Timeline Charts。这些可视化涵盖了整个项目生命周期,包括规划、预算、资源、进度安排以及项目和风险管理。
立即开始您的免费试用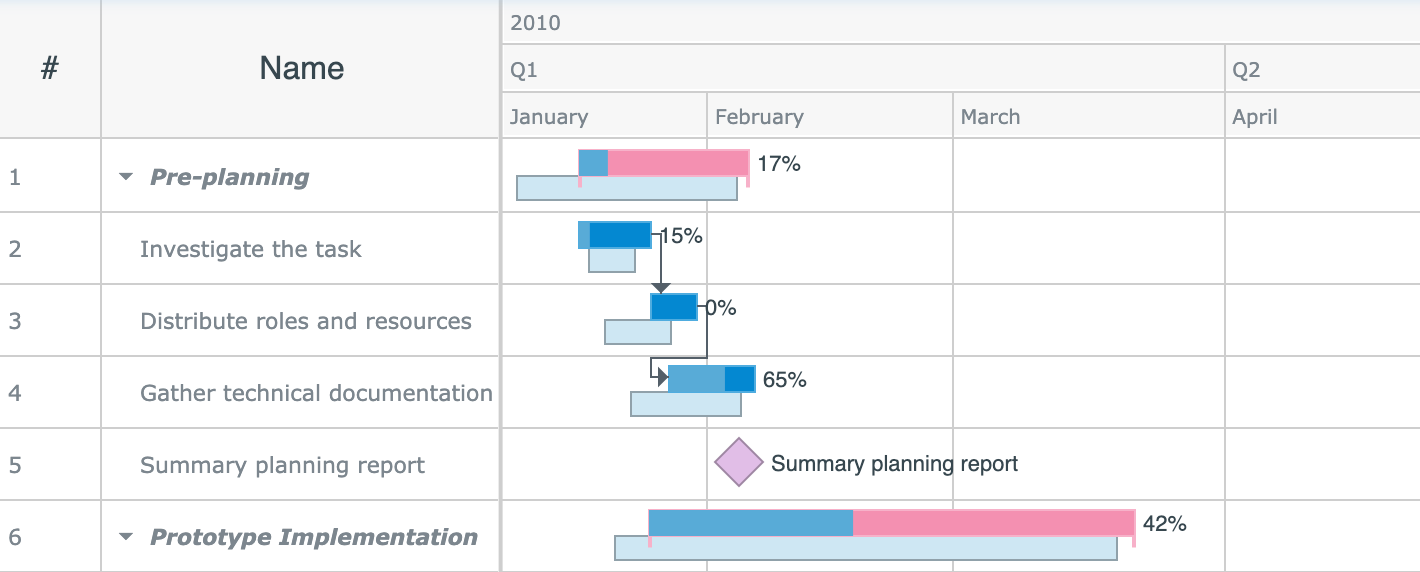
降低风险
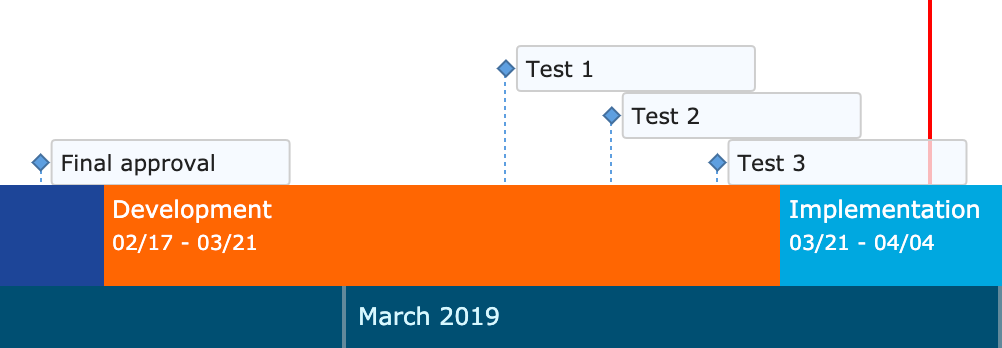
在整个组织内更广泛地获取数据,从而改进决策,将帮助您在项目崩溃前识别出有风险的项目。快速发现瓶颈并优化工作流程。Timeline charts 实时展示您的进度,让您能够立即对每个项目的状态做出更明智的决策。
立即开始免费试用
将您的项目数据带入 Qlik Sense
您可以轻松地从公司使用的任何系统(如 MS Project、Oracle Primavera 等)导入项目管理数据,并让整个组织在 Qlik Sense 内部都能看到这些数据。只需开始使用 AnyGantt Project Management Bundle!
立即查看演示
想了解它是如何处理您的数据的吗?只需 与我们预约 30 分钟的通话
Gantt 图表在不同行业中的使用示例


AnyChart 开发可视化数据工具已逾 20 年!
我们的产品获得了数据可视化和软件行业专家的诸多认可和奖项。