
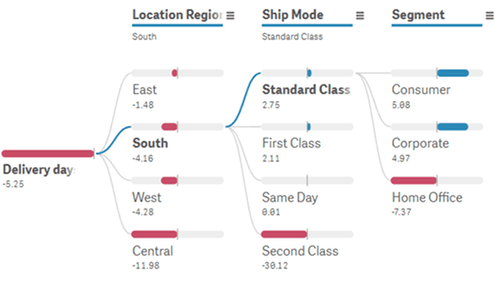

The Sankey Diagram extension for Qlik Sense visualizes how values flow between categories across multiple stages — from source to destination, through any number of levels.
Instantly reveals where the largest transfers occur in budgets, supply chains, customer journeys, or any multi-step process, with interactive selections that filter your entire Qlik model in a single click.