
堆叠瀑布图功能
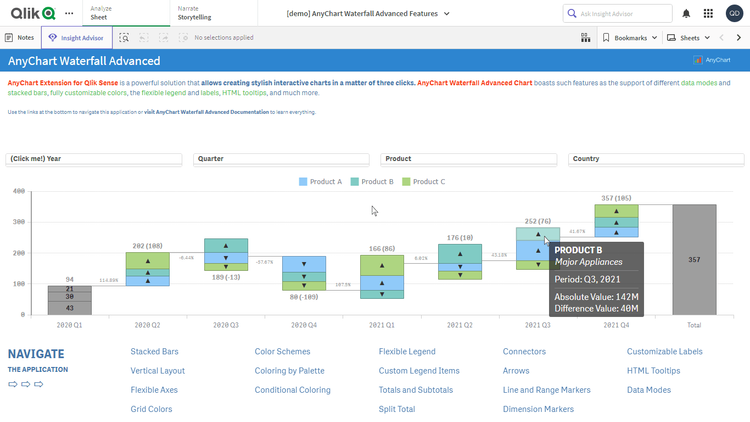
在 Qlik 中探索堆叠瀑布图!在这款 Qlik 演示应用中体验 Qlik Sense 高级瀑布图扩展的全部主要功能。
堆叠瀑布图功能


关于此应用
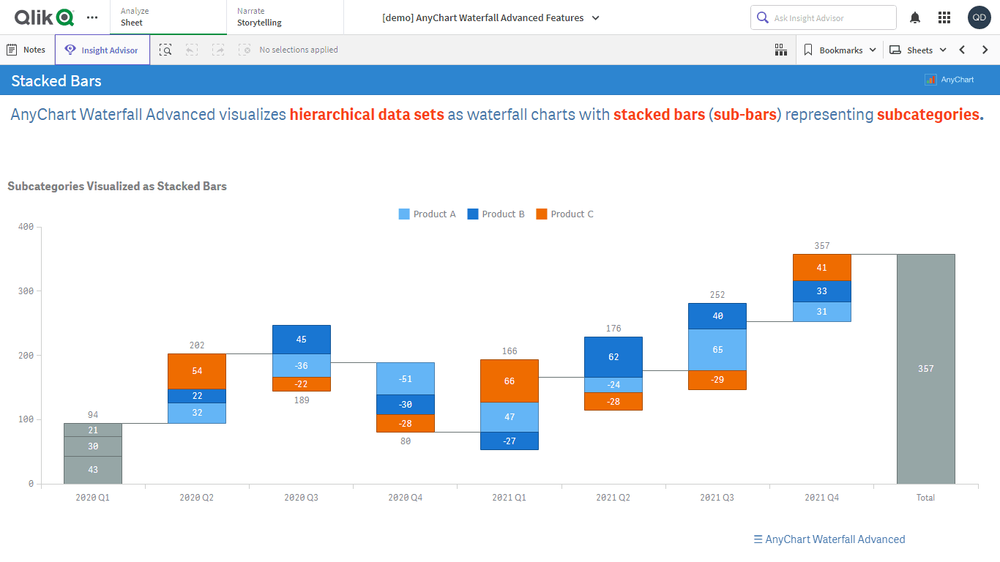
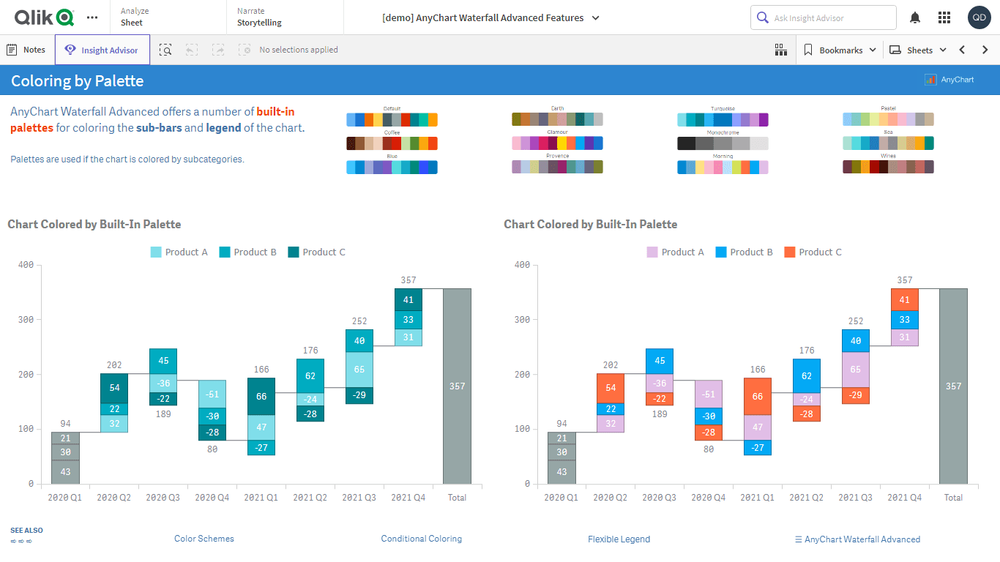
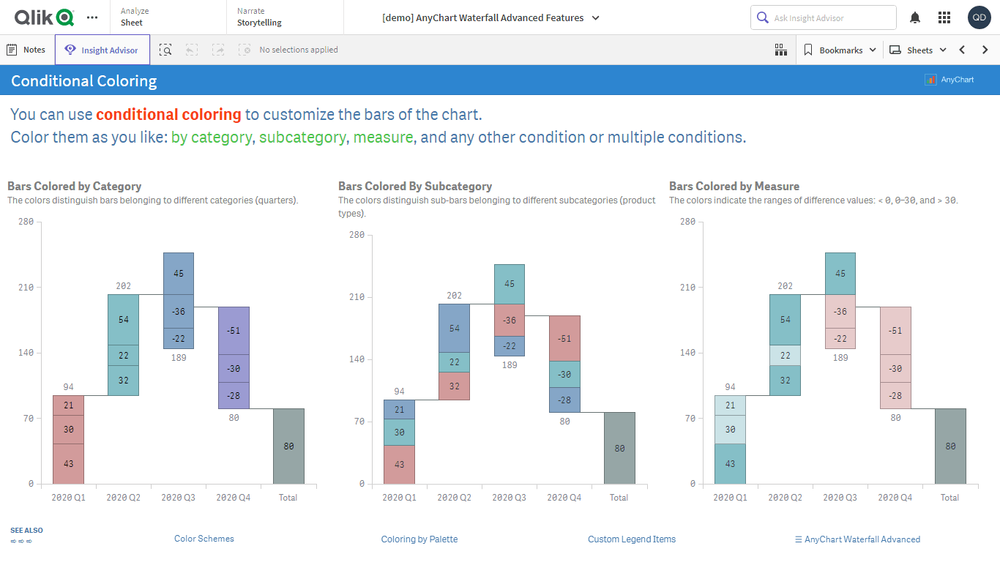
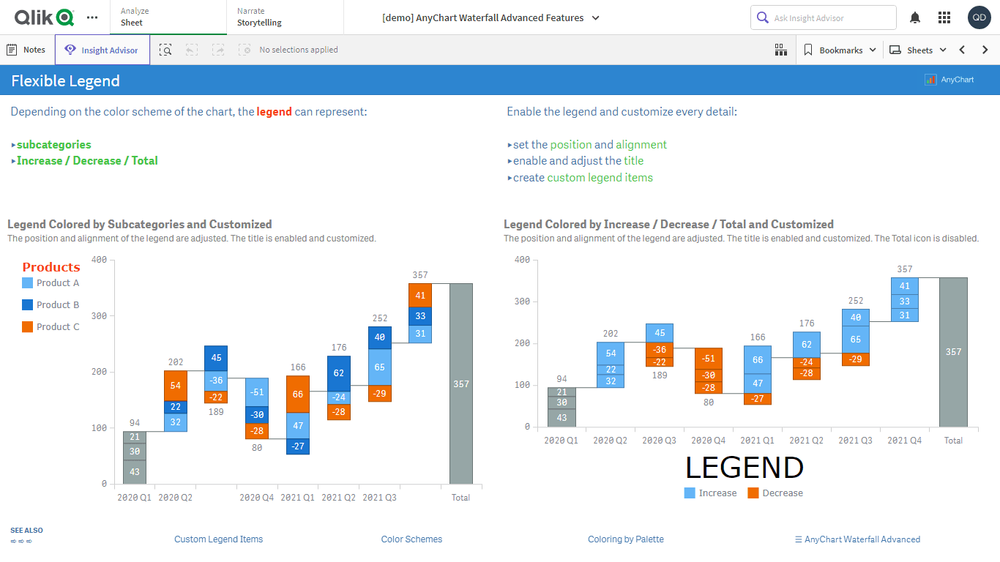
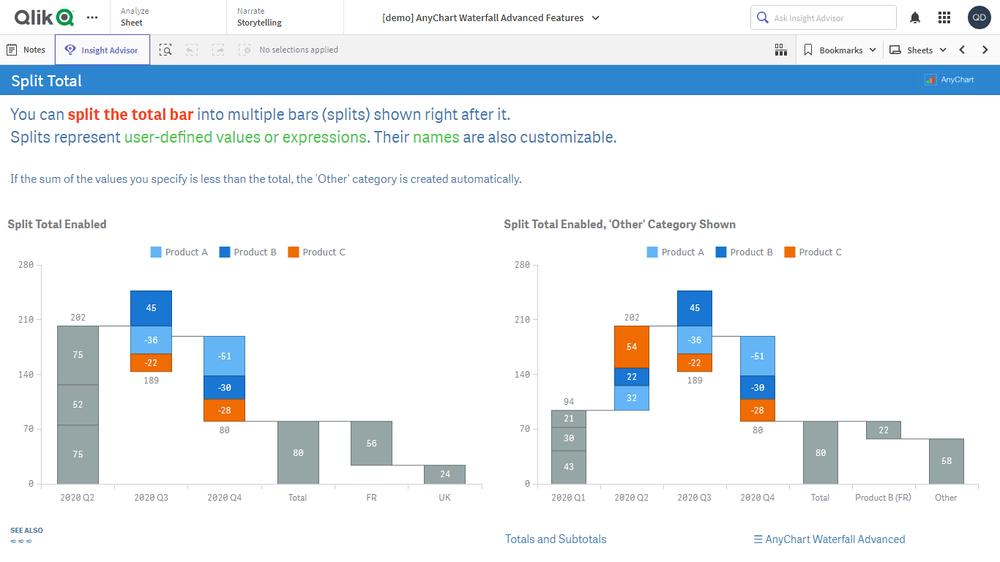
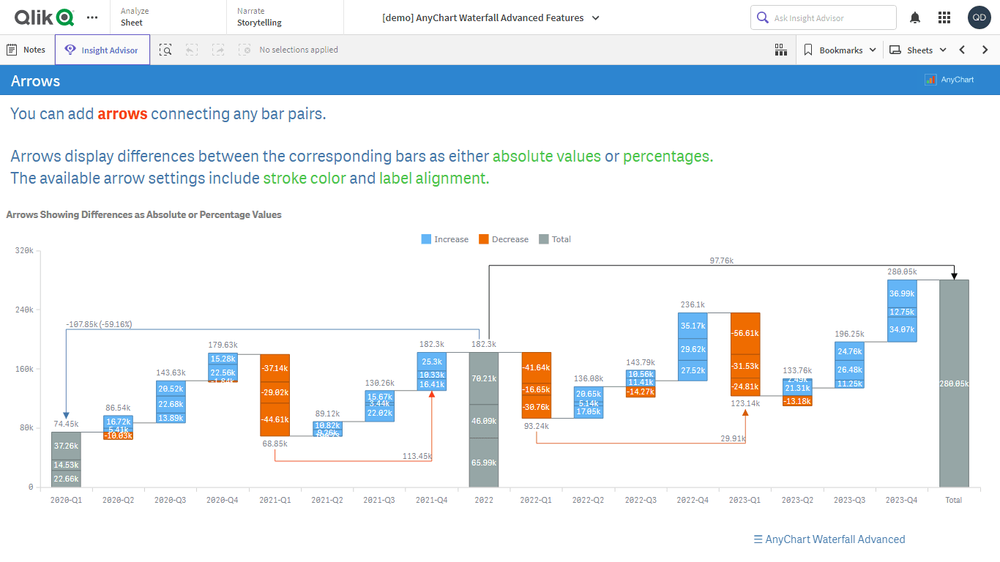
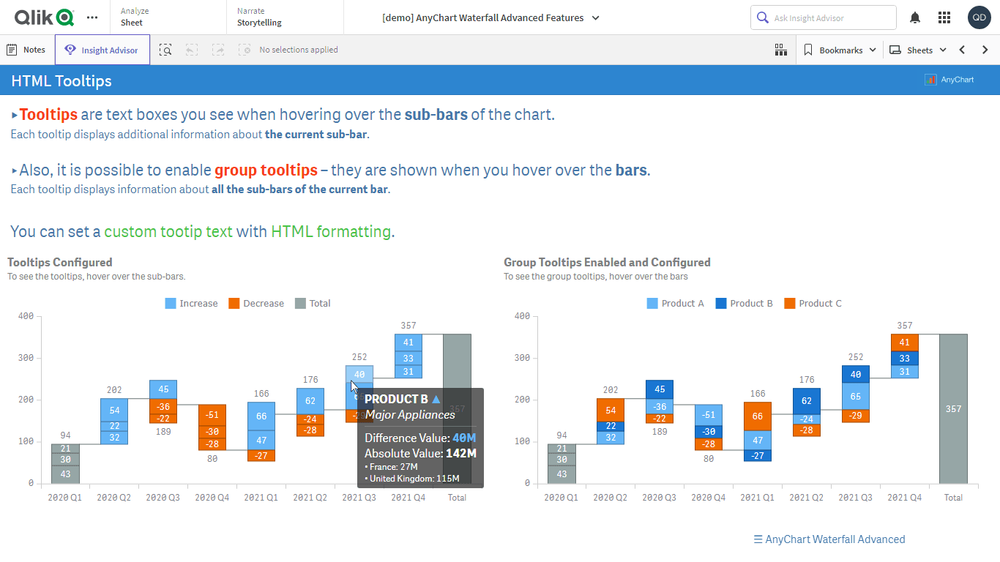
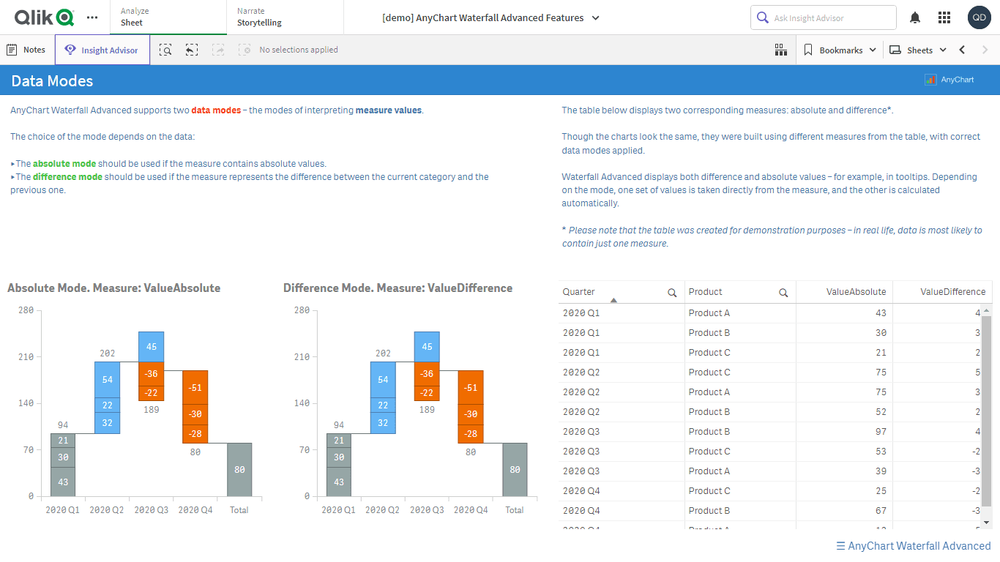
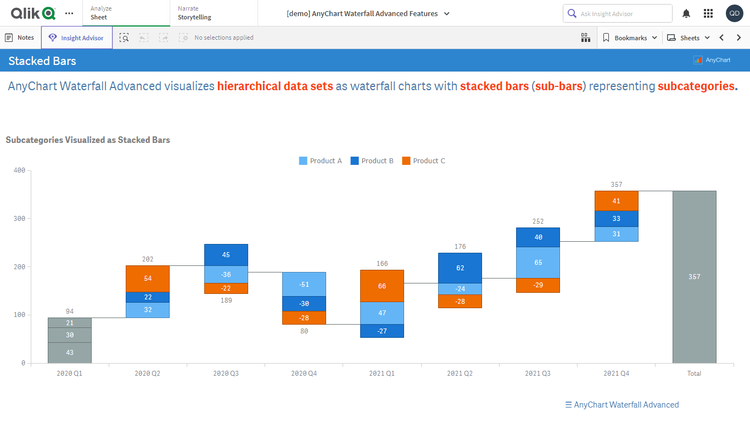
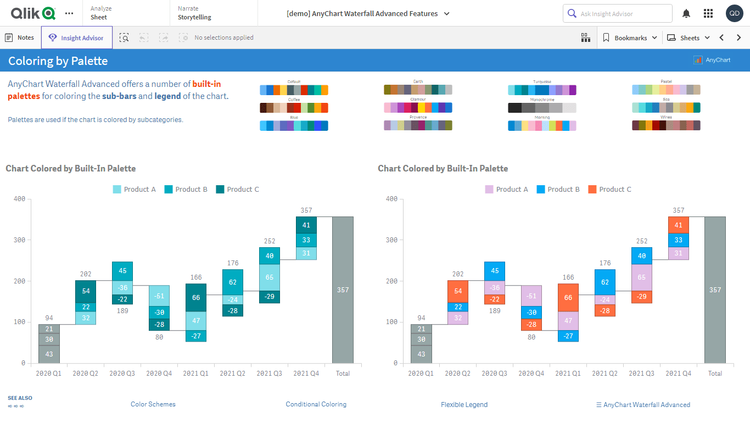
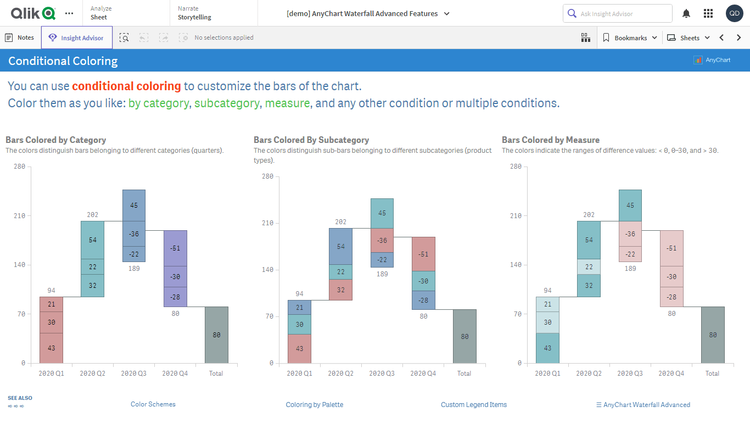
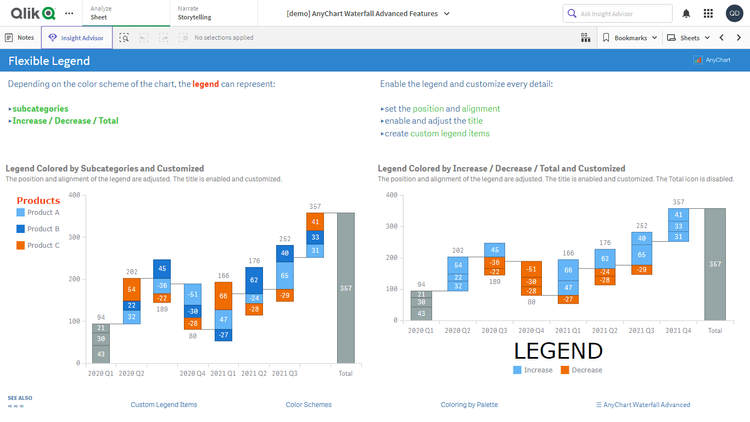
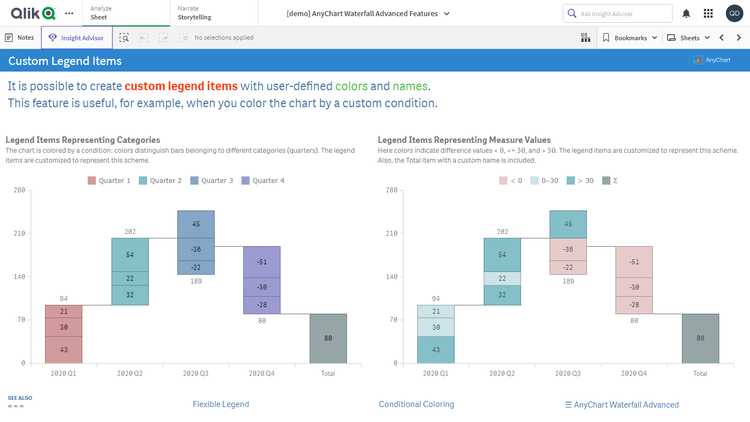
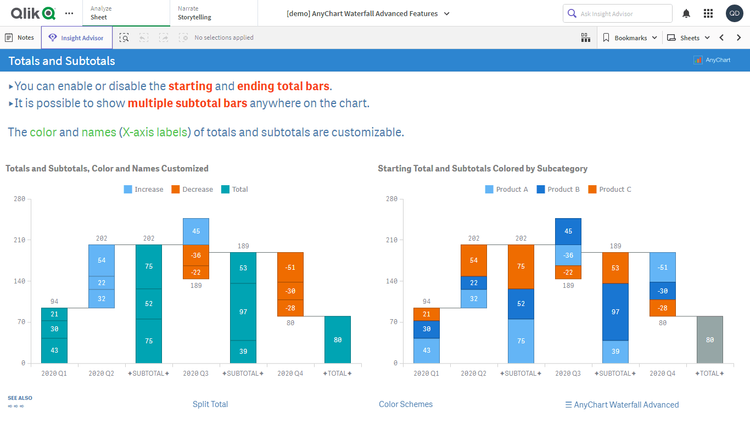
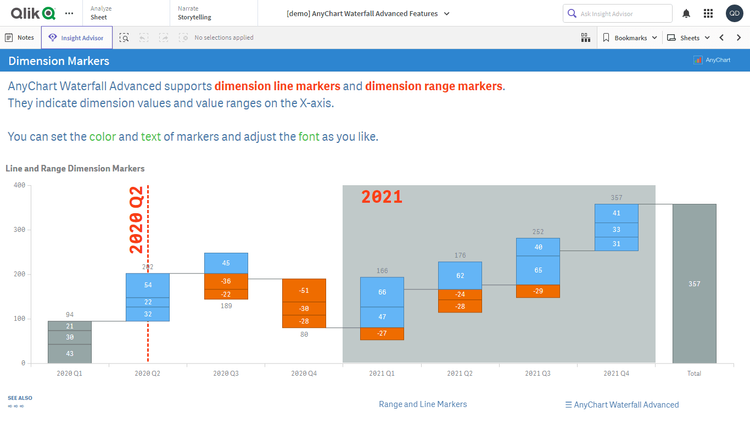
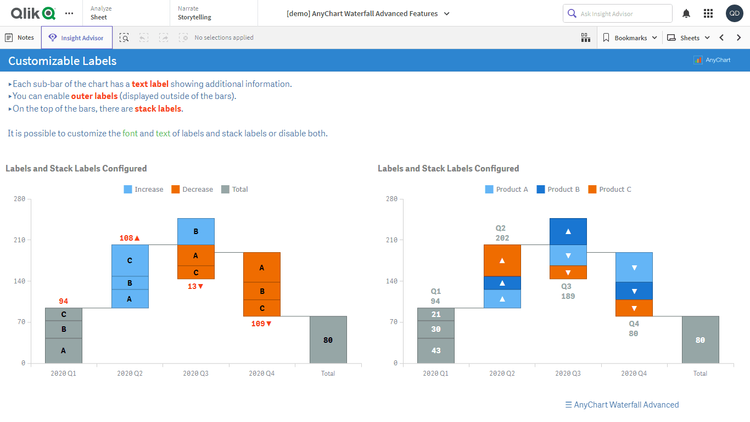
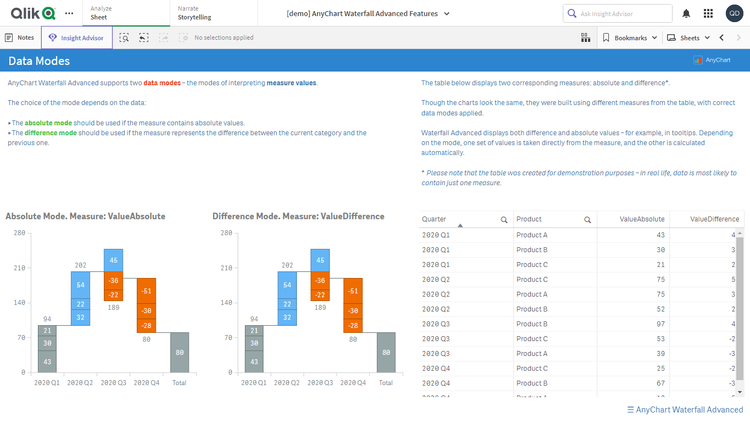
在 Qlik Sense 中探索堆叠瀑布图选项,分析分类与子分类中数值增减的累积效果。通过一个虚拟的产品指标可视化,体验我们直观的 Qlik Sense 高级瀑布图扩展的全部主要功能。查看主条形内的子条堆叠、不同数据模式、自定义标签等丰富功能的实际演示。
本应用展示了一个由 Qlik Sense AnyChart 扩展 构建的 高级瀑布图。数据为虚拟示例。