
学校设施项目(NYCSCA)
适用于 Qlik 的纽约市学校建设项目演示应用使用甘特图展示时间线。借助 AnyChart 扩展,在 Qlik 中体验高级可视化分析。
学校设施项目(NYCSCA)


关于此应用
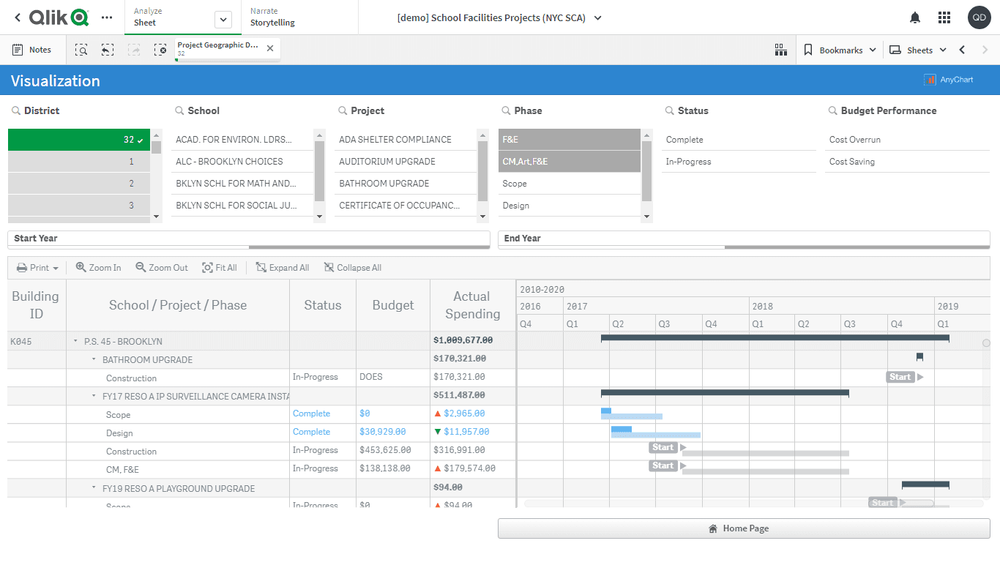
以透明的端到端视图梳理由纽约市学校建设局(NYCSCA)管理的所有学校设施建设项目时间线,覆盖当前在建项目及过去二十年内完成的项目。按阶段检查预算执行,瞬时识别成本超支与节省。对比原始进度计划与实际工期,及时发现不足与延误。
本应用包含一个项目甘特图,由 Qlik Sense 的 AnyGantt 扩展构建。数据集来自纽约市学校建设局(NYCSCA)公开发布的学校资本项目报告。
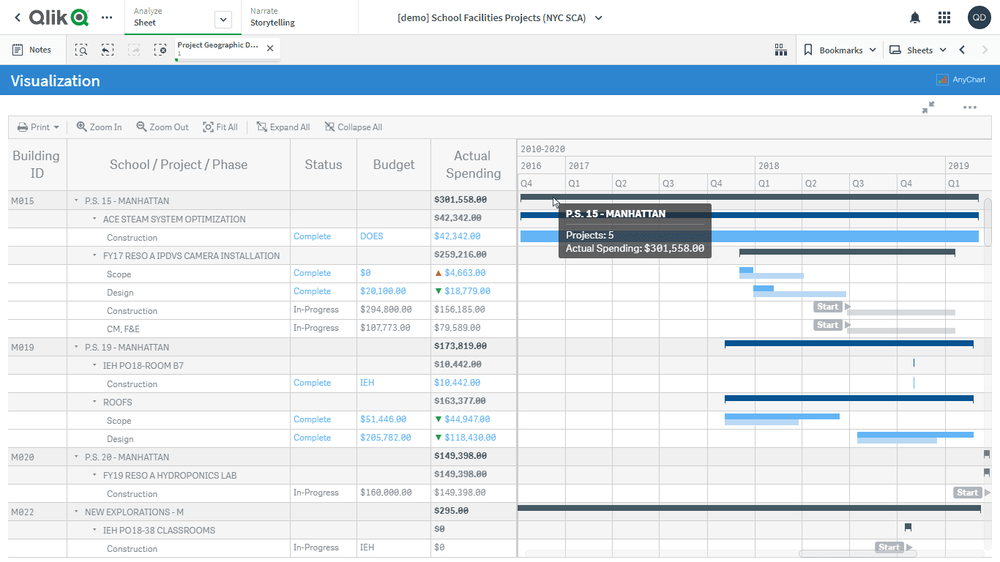
项目甘特图:
- 图表包含 3 个维度:School(学校)、Project(项目)和 Phase(阶段)。
- 通过表达式自定义索引列:在 School 层级显示建筑 ID,其余层级不显示。
- 表格含 3 个附加列:Status(阶段是否已完成或进行中)、Budget(预算)和 Actual Spending(实际支出)。
- 表格文本采用 HTML 格式化。
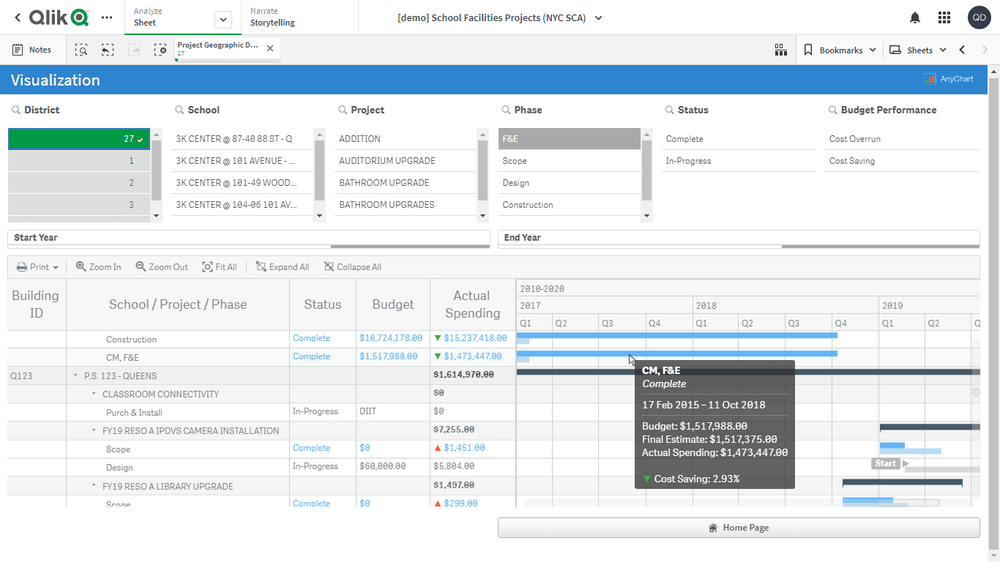
- 对于 Complete(已完成)阶段,Status、Budget 与 Actual Spending 文本显示为蓝色;在 Actual Spending 列使用 HTML 图标指示预算表现(超支或节省)。
- 在父级元素上,Actual Spending 列显示汇总值(School 为黑色,Project 为灰色)。
- 除常规元素外,如有相应信息,还会绘制基线条形。
- In-Progress(进行中)阶段以带标签的里程碑形式展示。
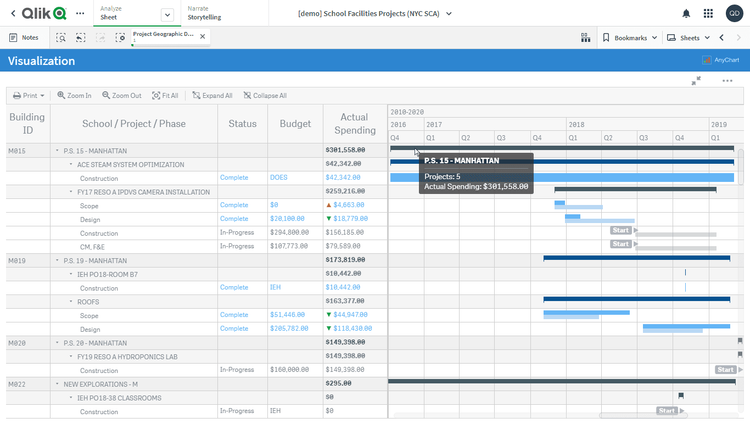
- 不同维度使用差异化提示框;阶段提示框采用 HTML 格式,并包含预算、最终估算与实际支出等信息;在数据充分时计算节省或超支比例,并使用与表格一致的彩色 HTML 图标展示。
其他功能:
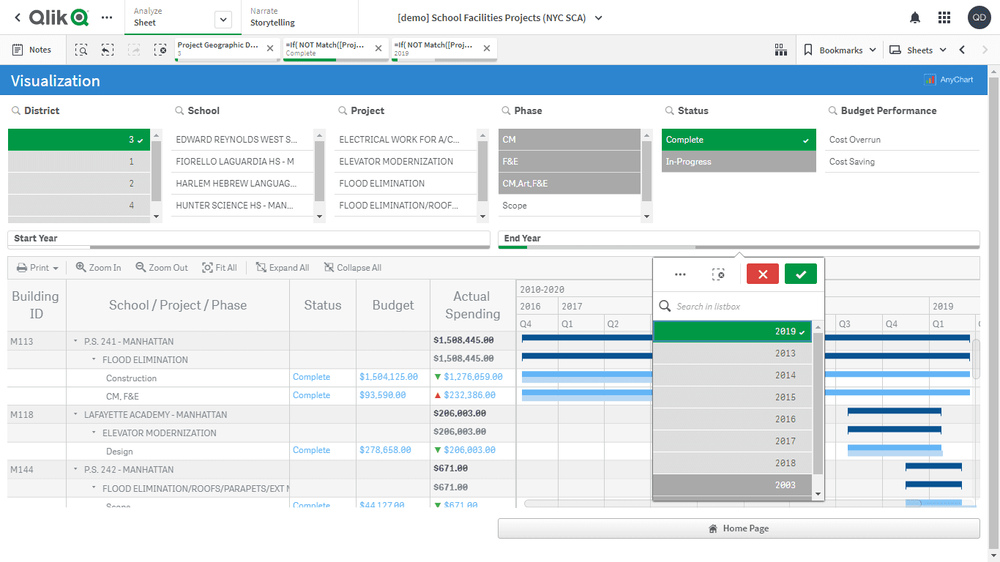
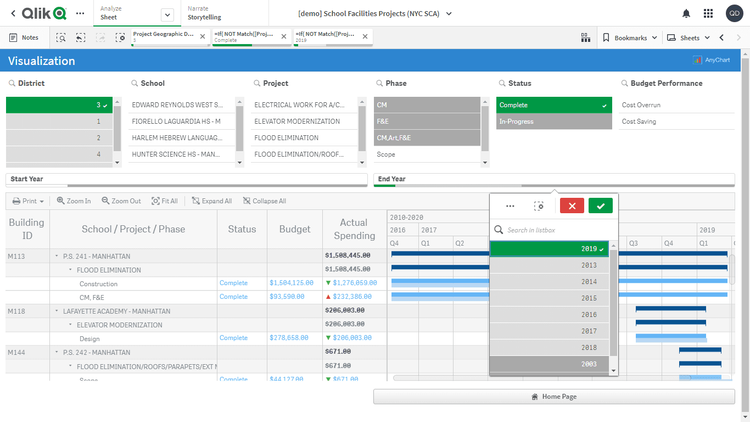
- 可按所有维度筛选:School、Project、Phase。
- 可按附加字段筛选:District、Status、Budget Performance,以及 Start Year 与 End Year。