


关于此应用
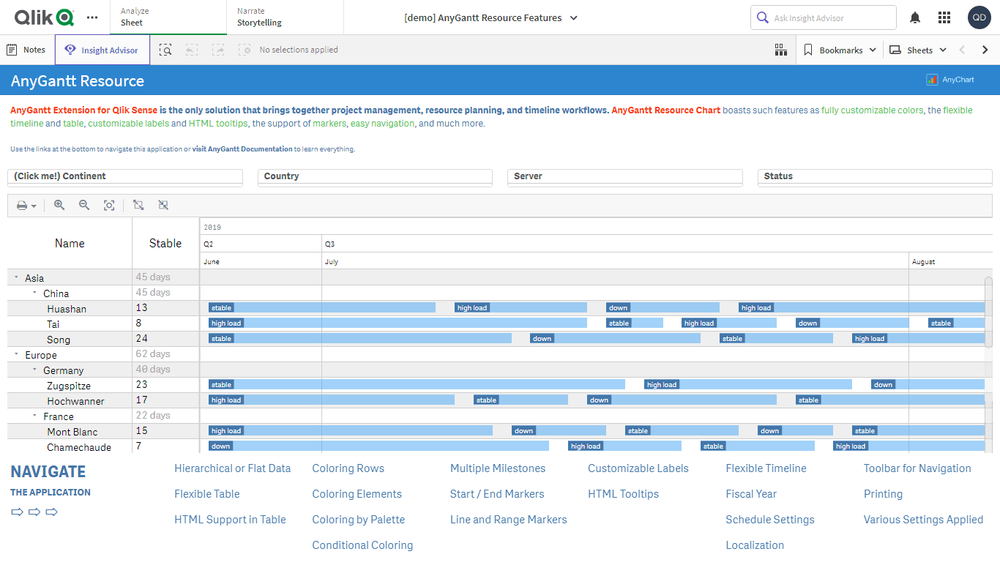
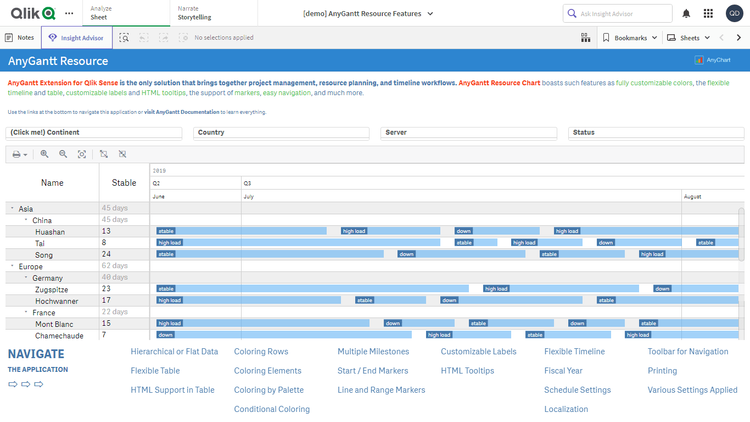
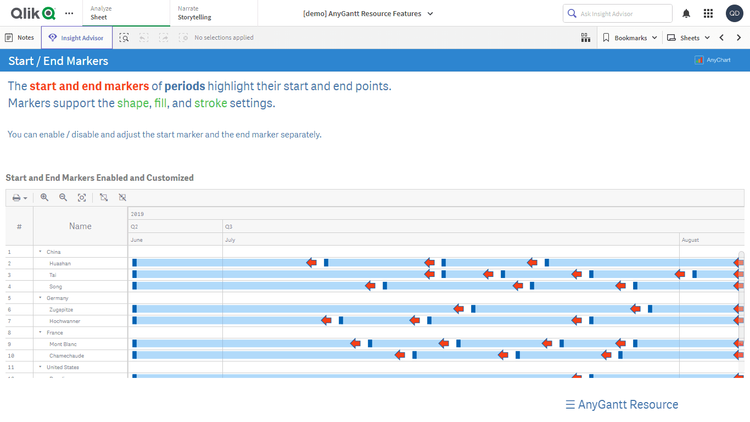
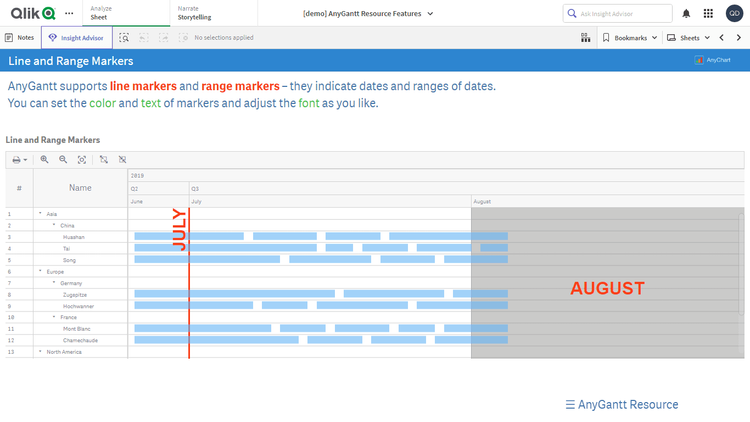
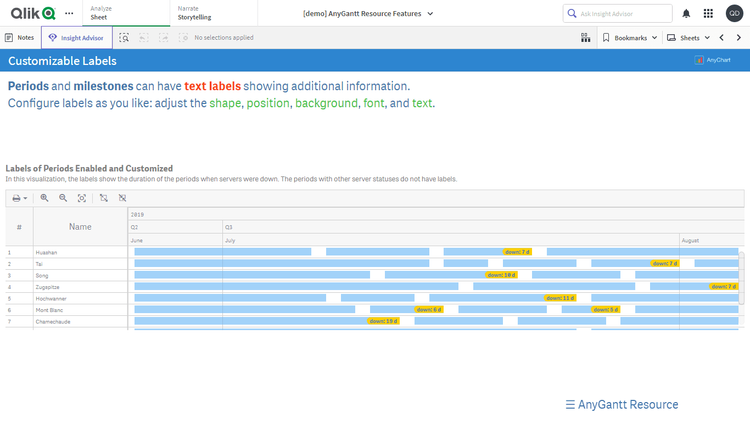
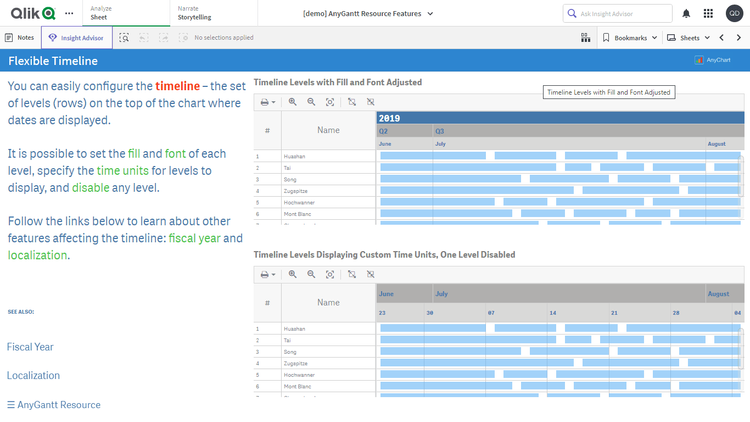
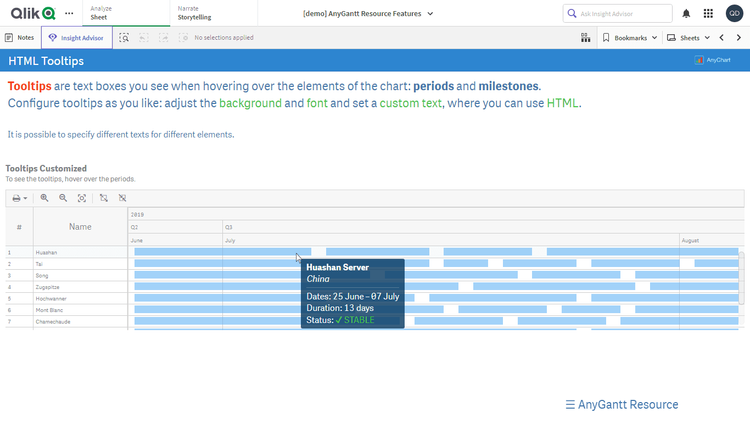
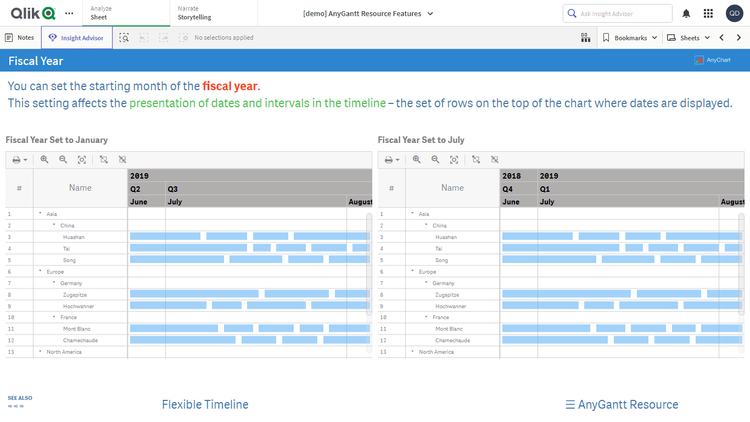
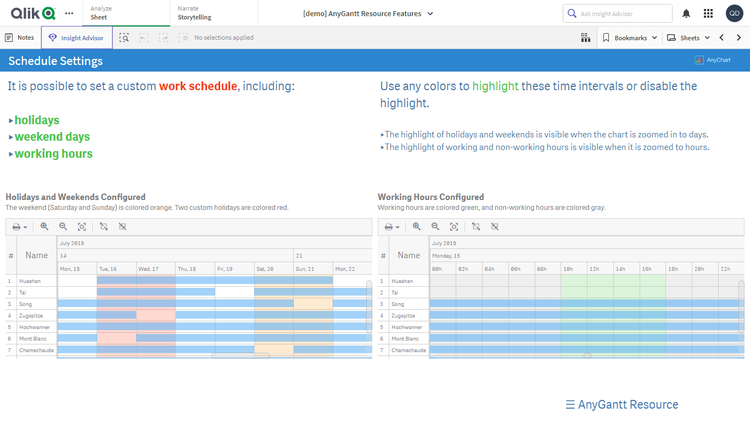
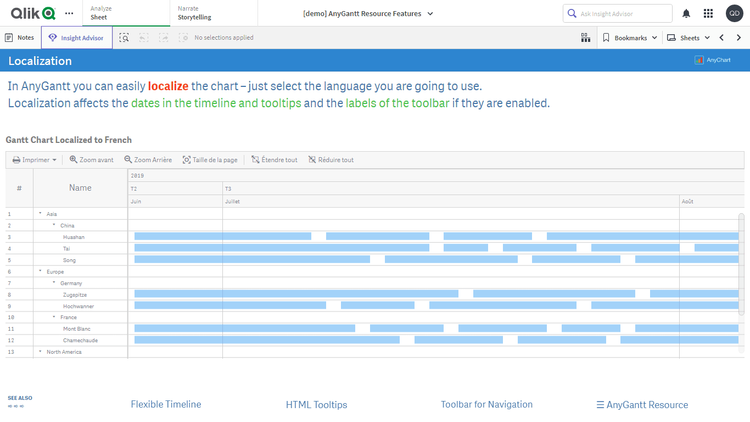
Resource Gantt charts enable you to manage resource allocation in an efficient and effective way. Explore all major features of our intuitive Resource Gantt Chart Extension for Qlik Sense while looking at this visualization of (fictional) resource use data. See different data structures, flexible tables and timelines, customizable milestones, labels, markers, coloring, fiscal year settings, and much more demonstrated in action.
This application features a Resource Gantt Chart built with the AnyGantt extension for Qlik Sense. The dataset is fictional.