
项目甘特图功能
甘特图是必不可少的项目管理工具。在这款 Qlik 演示应用中探索 Qlik Sense 项目甘特图的全部主要功能。
项目甘特图功能


关于此应用
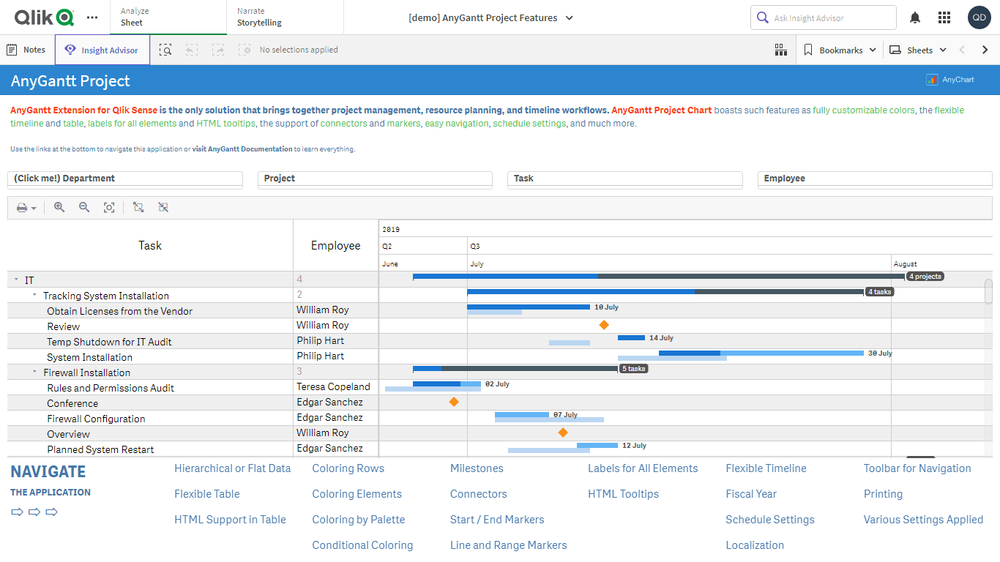
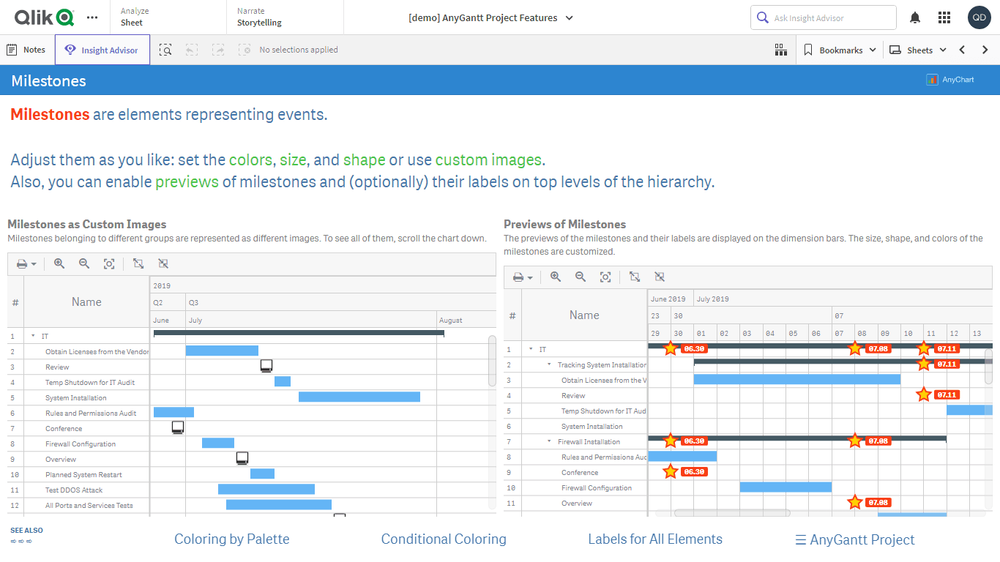
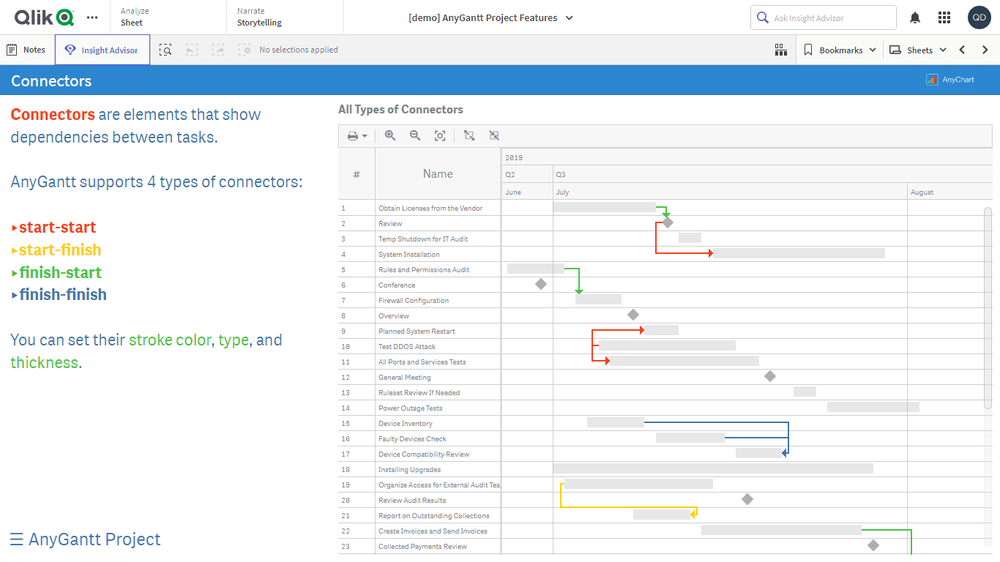
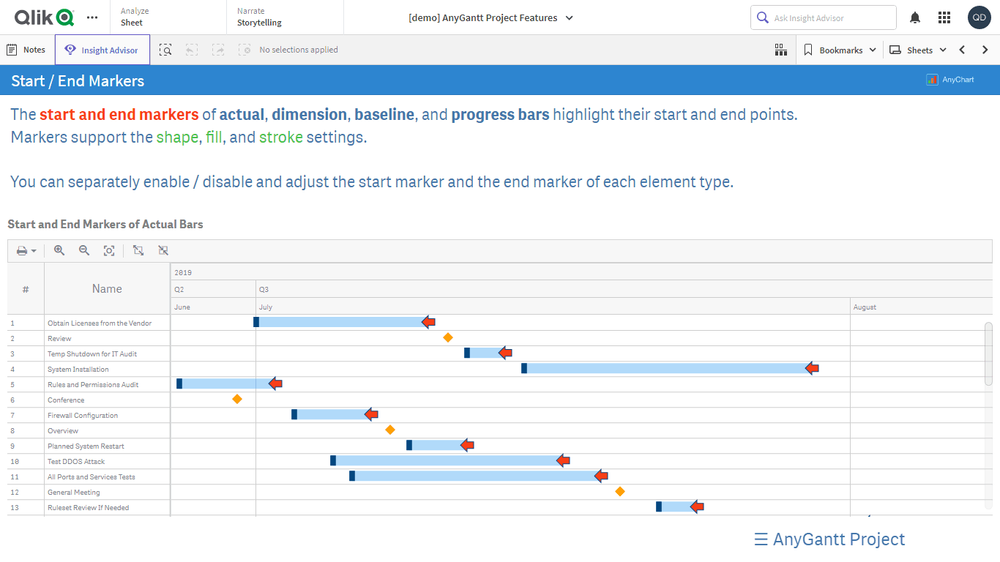
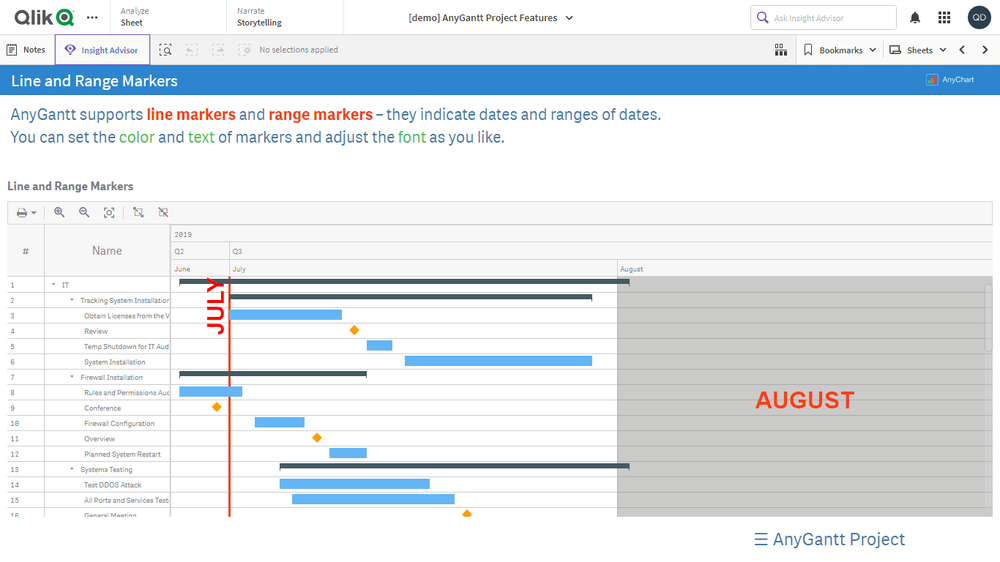
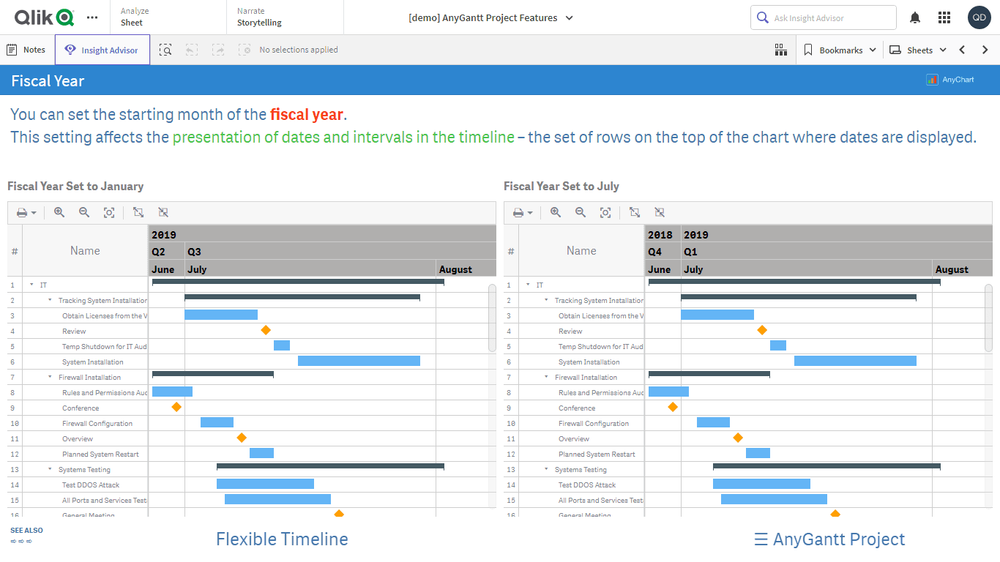
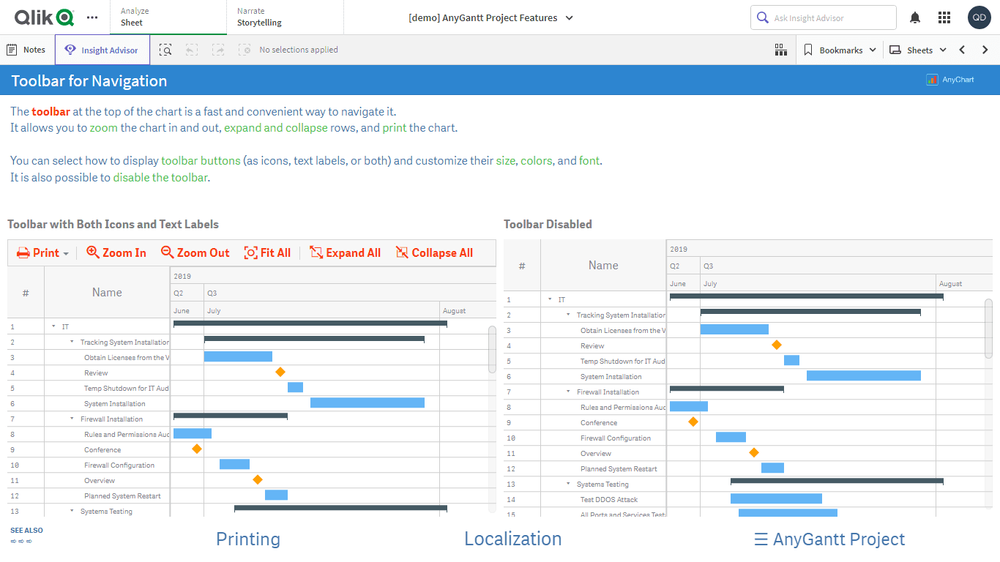
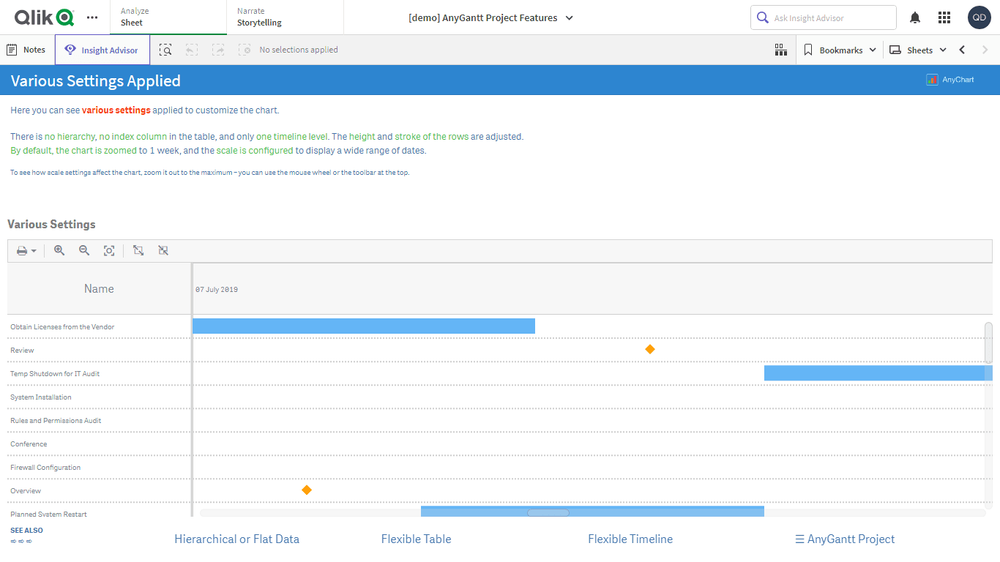
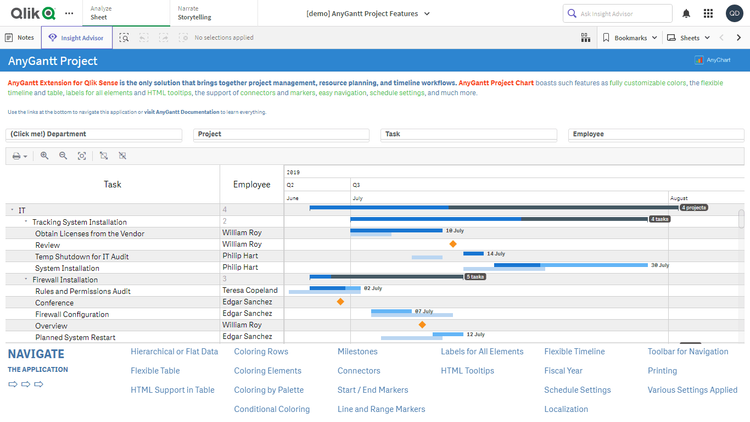
甘特图是必不可少的项目管理工具,非常适合展示项目进度。通过一个虚拟的项目数据可视化,探索我们直观的 Qlik Sense 项目甘特图扩展的全部主要功能。体验不同的数据结构、自定义表格与时间线、灵活的里程碑、依赖关系连接器、财年设置、配色模式等丰富功能的实际演示。
本应用展示了一个由 Qlik Sense AnyGantt 扩展 构建的 项目甘特图。数据为虚拟示例。