

Qlik Connect 2025 with AnyChart
Visit AnyChart at Booth #1007 — Win Apple Prizes!
Disney's Coronado Springs Resort, Florida
May 13–15, 2025
Get Ready for Qlik Connect 2025 in Sunny Florida
Qlik Connect returns this spring to the Orlando area — and it is shaping up to be something special! From May 13–15, 2025, Qlik customers, partners, and experts from around the world will gather at Disney's Coronado Springs Resort in Lake Buena Vista, FL, to explore what's next in data, analytics, and AI. Expect inspiring keynotes — including Olympic legend Katie Ledecky and Qlik CEO Mike Capone — plus deep product insights, hands-on learning, and more real-world perspective than ever before — all designed to help you unlock the true value of your data.
We at AnyChart are excited to return as a sponsor and exhibitor, building on the energy and conversations from Qlik Connect 2024. Our team will be on-site, ready to share how our powerful Qlik Sense extensions can boost the way you visualize, interact with, and act on your data. Alongside upgraded favorites like the Decomposition Tree and Gantt Chart, we'll be unveiling something new — Spreadsheets, a fully integrated component that brings Excel-style flexibility right into Qlik Sense.
Come find us at Booth #1007 to connect, see what's new, and talk about how we can help you make your data work harder — faster, smarter, and with no compromises. We look forward to seeing you at Qlik Connect 2025 in sunny Florida!
Enhance Your Qlik Analytics Apps with Unique Tools for Data & Visualization
Named Best in Data Analytics & Visualization in 2024, AnyChart is heading to Qlik Connect 2025 — come see how our extensions for Qlik Sense can help you build smarter dashboards and deliver the faster, deeper insights your users deserve.


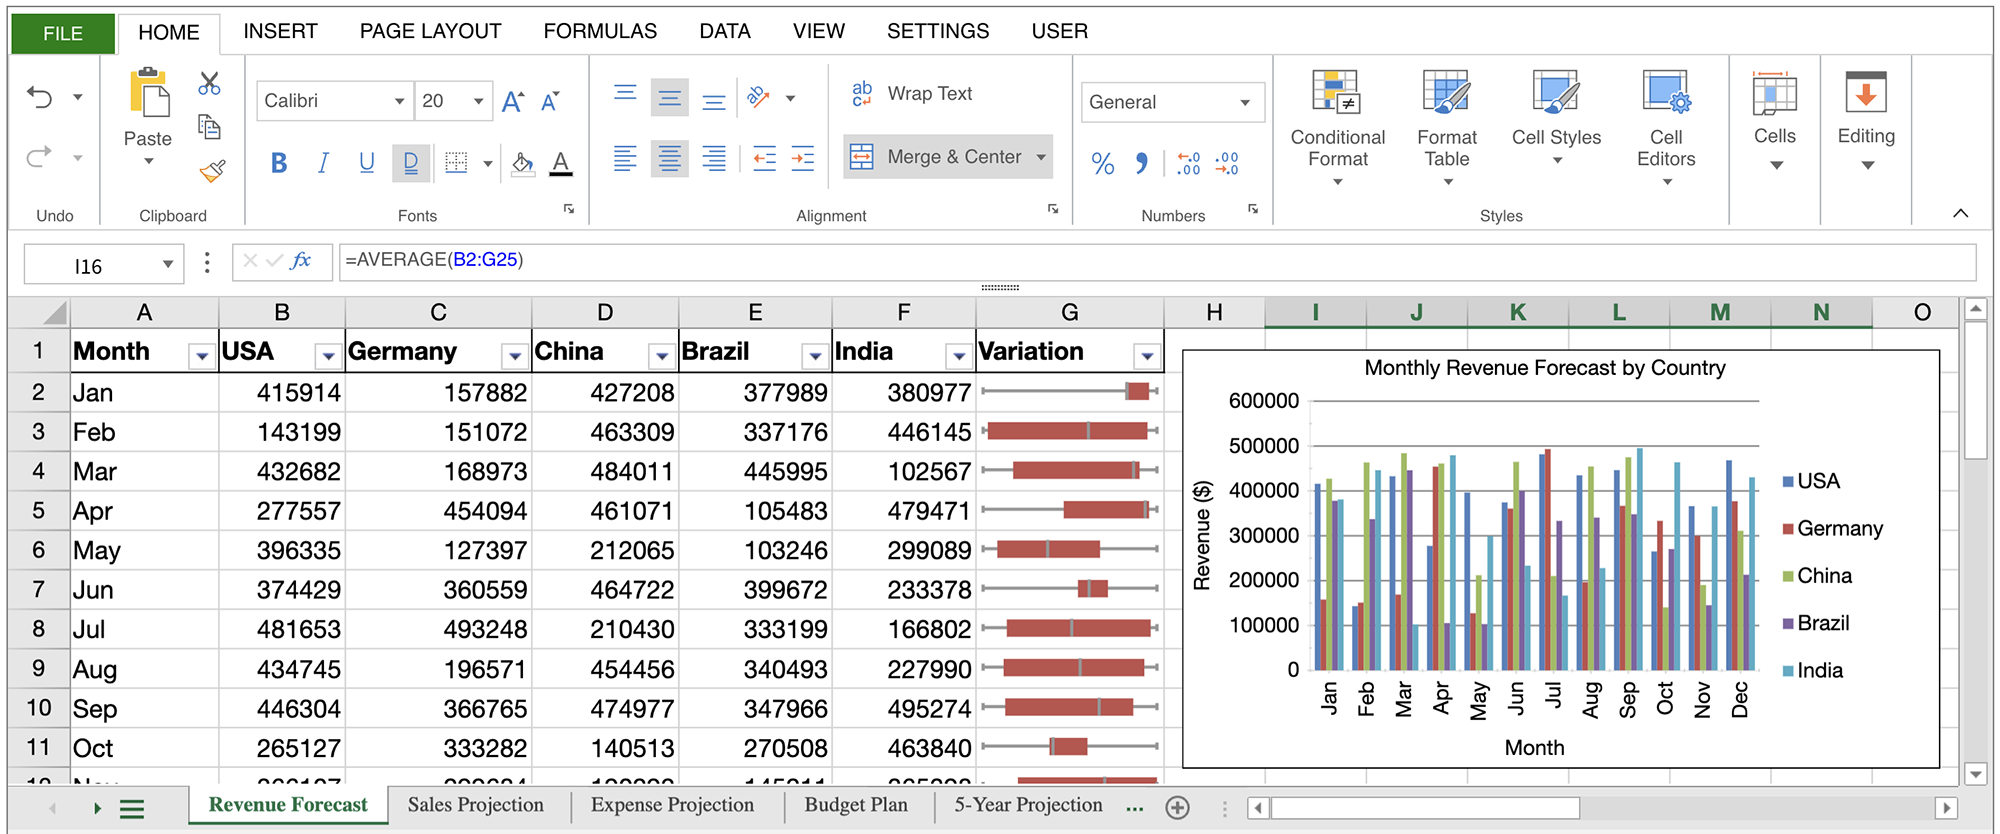
Spreadsheets
Bring the familiar power of spreadsheets to your Qlik Sense dashboards with our fully integrated Spreadsheets component.
Inspired by the ease and flexibility of Excel, this brand-new extension empowers users to interact with data in a way they already know — no training required.
Perfect for custom reporting, ad-hoc analysis, and writeback workflows, it enables seamless formatting, calculations, and layout control, all while staying connected to live Qlik data.
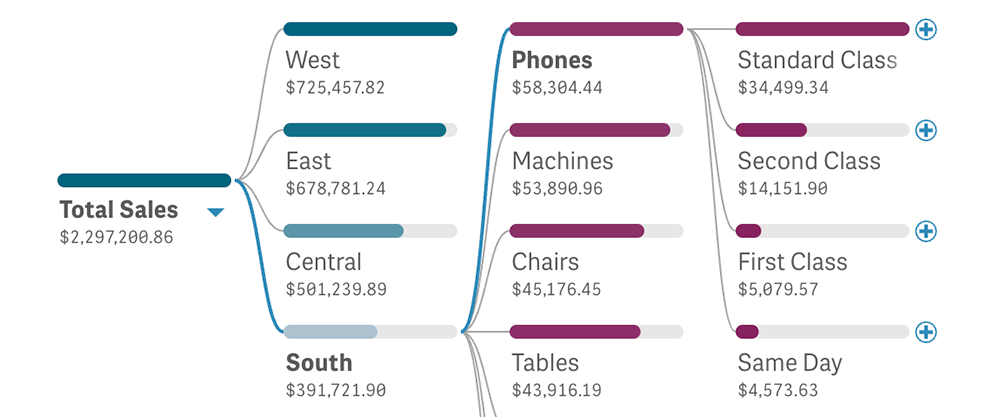
Decomposition Tree
Enhance your dashboards with our Decomposition Tree — a smart interactive tool for metric breakdown and driver analysis.
Proven in Power BI and now available in Qlik Sense through our extension, this advanced visual lets users intuitively dissect totals across multiple dimensions to uncover key contributors, trends, and outliers — all within a single, dynamic view.
The newly added AI Splits feature automatically detects the most statistically significant segments and accelerates deeper insight.
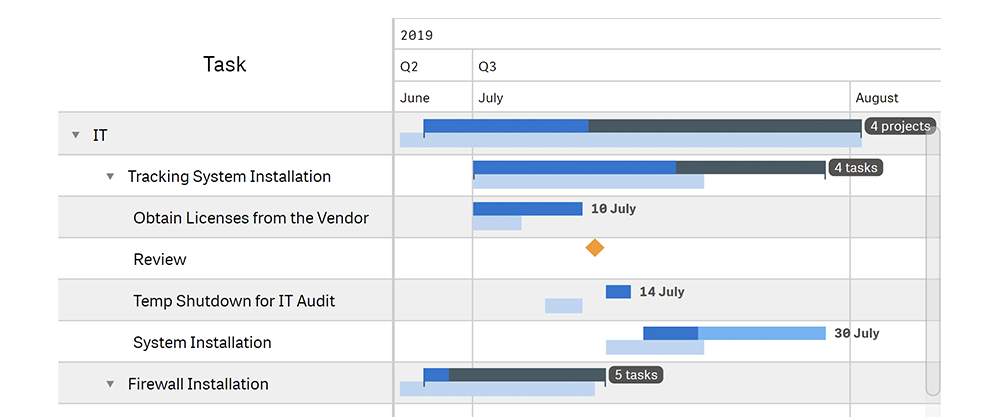
Gantt Chart
Make project management intuitive with our Gantt Chart — recognized by customers as the most complete and flexible Gantt solution for Qlik Sense.
Create detailed, interactive timelines that bring structure to project schedules by visualizing task flows, key milestones, and dependencies — helping teams stay aligned, understand priorities, and track progress at every stage.
A dedicated extension for efficient resource allocation is also available, simplifying workload balancing and maximizing productivity across all initiatives.
Enter for a Chance to Win Apple Prizes at Qlik Connect 2025
Visit Booth #1007 to try your luck at winning a MacBook, Apple Watch, iPad, and more.| Date | Time | Prize |
|---|---|---|
| May14 | 5:15 PM | AirPods 4 |
| 5:30 PM | AirTag 4 Pack | |
| 5:45 PM | iPad Air | |
| May15 | 4:15 PM | AirPods Max |
| 4:20 PM | Apple Watch 10 | |
| 4:25 PM | MacBook Air |
Pick up your free ticket at Booth #1007. Return at the scheduled time, scan your ticket — and try your luck!
No purchase necessary. Winner must be present to win. Times may change — check at the booth.Join Us at Qlik Connect 2025
Registration is open — claim your spot today and plan to connect with us at the show!AnyChart has been developing visual data tools for over 20 years!
Our products have received a lot of recognition and awards from data visualization and software industry experts.


North American Headquarter
AnyChartP.O. Box 840180
St. Augustine, FL 32080
USA
Technical Support Team
support@anychart.com