Excel-Style Spreadsheets for Qlik
Add spreadsheet power to your dashboards with live Qlik data in an Excel-like interface

Current and Future Leaders trust us
More than 75% of the Fortune 500 companies and thousands of startups are happy with AnyChart
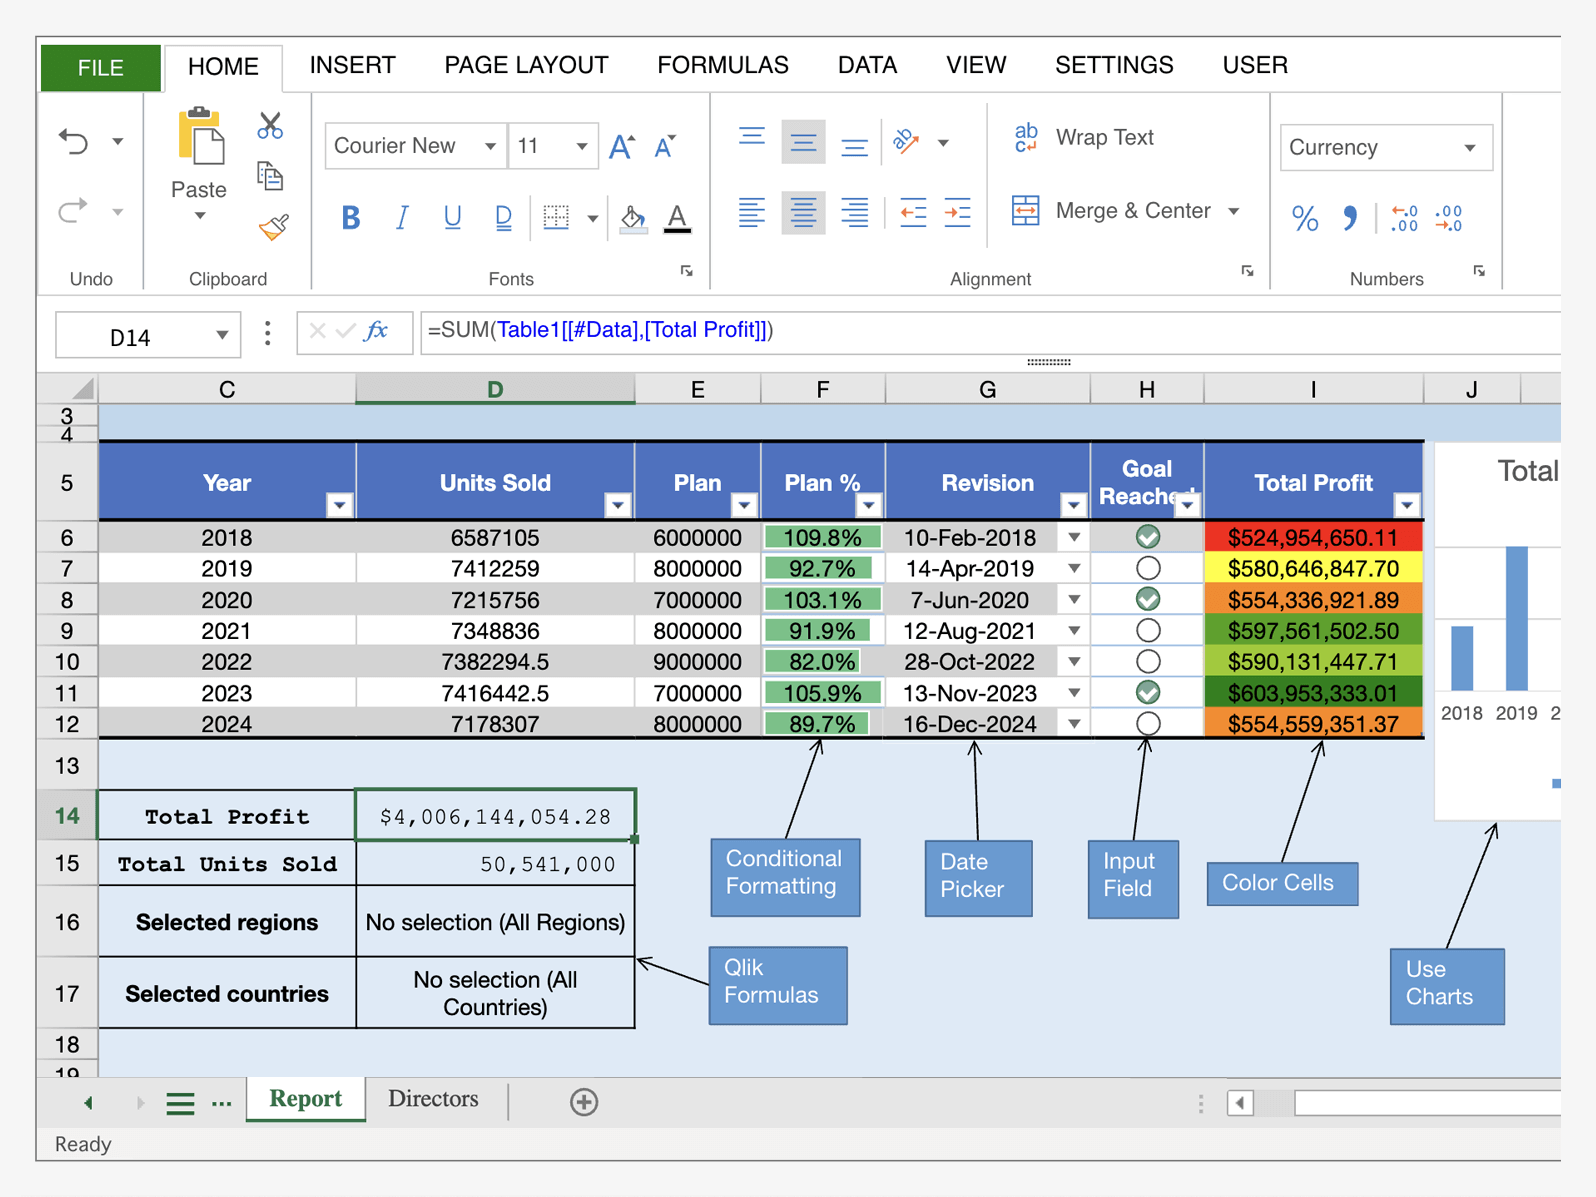
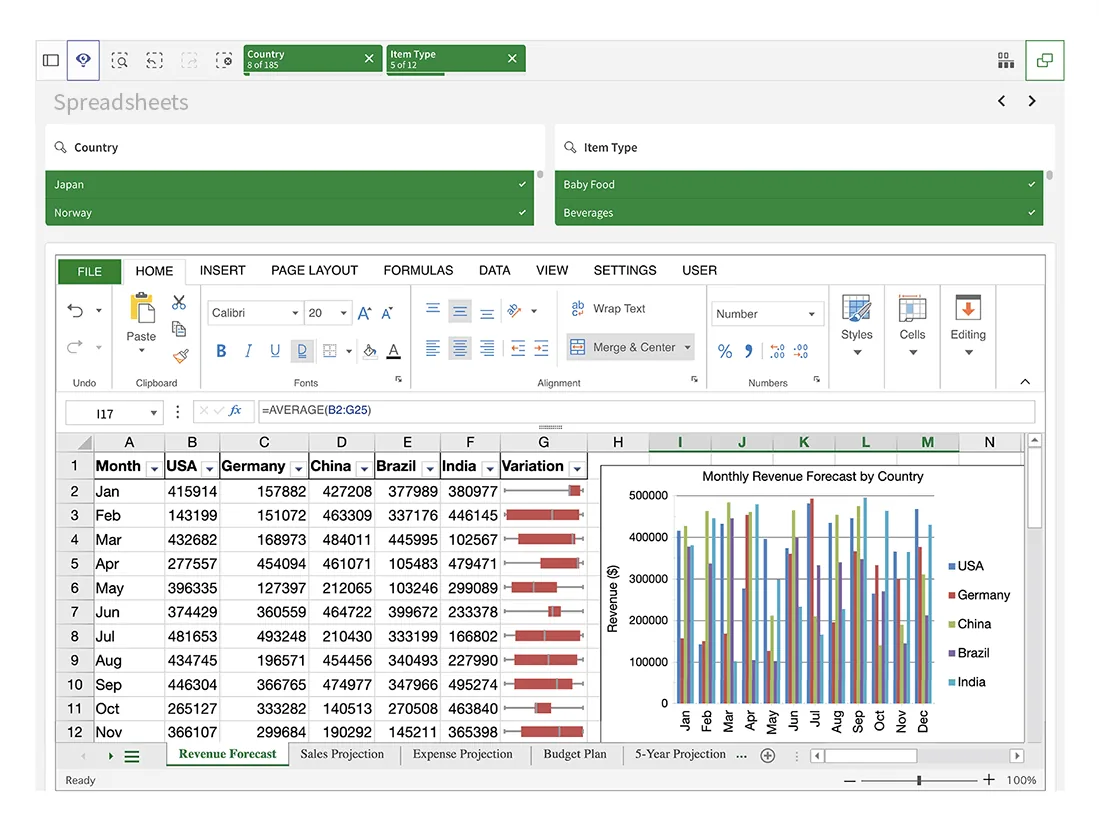
Ultimate Spreadsheets in Qlik Sense
Microsoft Excel set the standard for working with structured data. The Spreadsheets extension for Qlik Sense brings that familiar power straight into your dashboards, letting users view, edit, and analyze live Qlik data in a tabular interface they already know — with zero learning curve.
Users can intuitively sort and filter data, apply formulas and functions, customize formatting and layout, build charts in-sheet, search, freeze rows, use keyboard shortcuts, and more — just like in Excel.
Combining simplicity and flexibility, the Spreadsheets extension supports everything from reporting to hands-on data exploration. Use it standalone or embed it alongside visualizations to enrich your Qlik apps with trusted spreadsheet experience.
See Spreadsheets for Qlik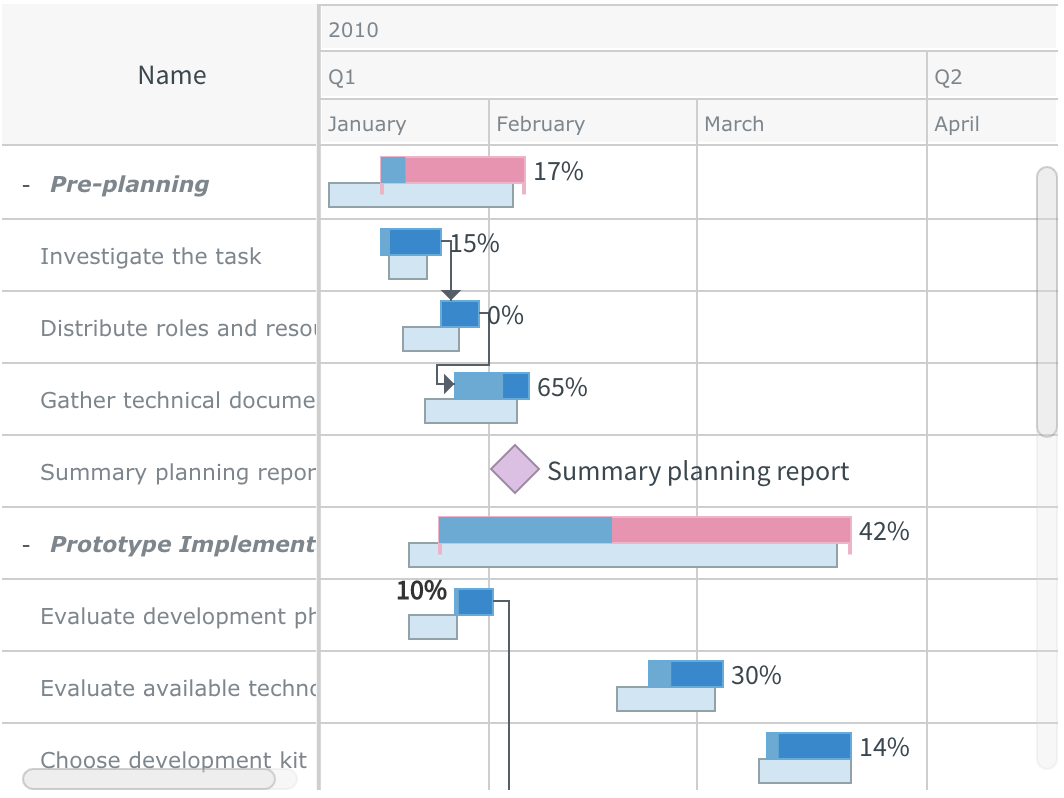
Top-Notch Gantt Charts in Qlik Sense
Project management is the cornerstone of any business success, and Gantt charts are a great tool to boost its effectiveness ensuring insightful, data-driven activity scheduling and resource allocation. AnyGantt Extension for Qlik Sense gives you the power to create such smart visualizations real quick in Qlik, the best software for BI experts and analysts to deal with data.
Easily make intelligent, interactive Gantt charts in an intuitive interface to define project tasks, assign them to the team, track in-progress assignments, monitor resource occupancy, and do other related management activities based on data. Enjoy numerous data visualization features of AnyGantt for the best possible user experience, including zoom, HTML tooltips and labels, flexible timeline, rich data grid control, and much more — all easily configurable and customizable.
See Gantt Charts for Qlik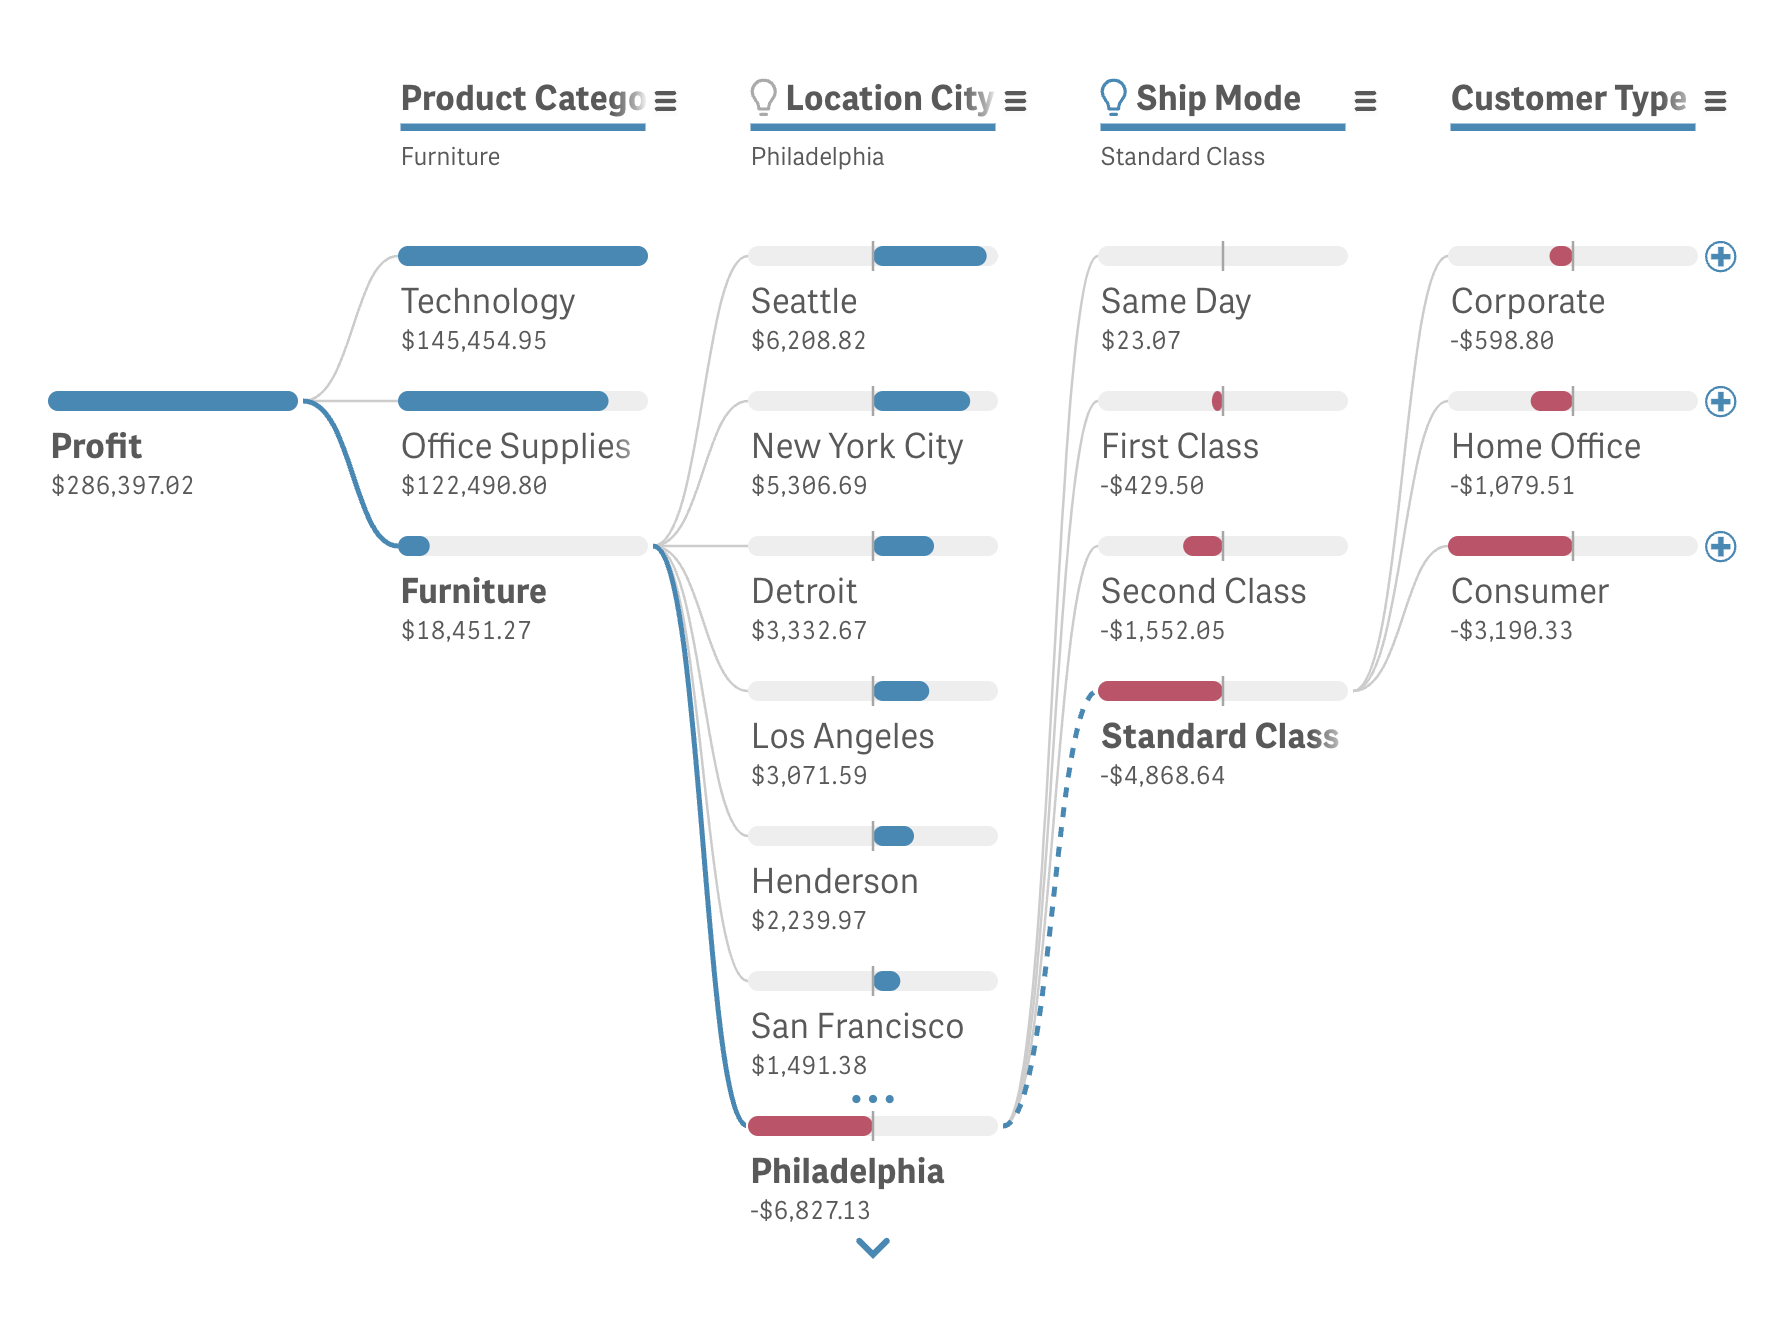
Exclusive Decomposition Trees in Qlik Sense
The decomposition tree visual provides a granular view of core metrics by splitting them into multiple dimensions. It enables intuitive root cause analysis and in-depth ad hoc data exploration on a single sheet to reveal key impact factors — now automatically with AI Splits — to optimize performance (and profits). The Decomposition Tree extension for Qlik Sense is a cutting-edge tool to create elegant decomposition trees in just a few clicks, with the ease one has come to expect from Qlik.
Choose the order of dimensions in a breakdown or let users decide which dimension to drill down into next. Apply conditional coloring for at-a-glance insights. Add multiple measures for comprehensive analysis. Set the desired view mode and paging to ensure a perfect fit in your BI dashboard.
See Decomposition Tree for QlikUnique Tools for Your Apps, Mashups, and Dashboards
Amazing Excel-like Spreadsheets and scores of out-of-the-box chart types
You Are a Qlik Away from Visualizing Your Dreams with AnyChart!
Developer-driven for real-world solutions
A AnyChart desenvolve ferramentas visuais de dados há mais de 20 anos!
Nossos produtos receberam amplo reconhecimento e prêmios de especialistas em visualização de dados e software.