

As 2025 winds down, we want to say thank you to our customers, partners, and everyone who builds and uses analytics every day. Merry Christmas and Happy New Year from all of us at AnyChart!
Closing out 2025, we are sharing this holiday sweater as a small nod to a theme we focused on this year 👇
BI platforms are more capable than ever, but spreadsheets do not go away. In Qlik and elsewhere, Excel shows up as a practical need because it is a fast way to turn a question into a working model:
- Change an assumption
- Run a what-if
- Sanity-check numbers
- Share it in a format everyone can open
The problem is the export loop. Once that spreadsheet leaves the BI app, it becomes a side file, then a chain of copies, and the same logic and definitions start drifting across versions.
This is why we built Spreadsheets for Qlik. We first demoed this Qlik Sense extension at Qlik Connect 2025 in Orlando, and it was our biggest product release of the year.
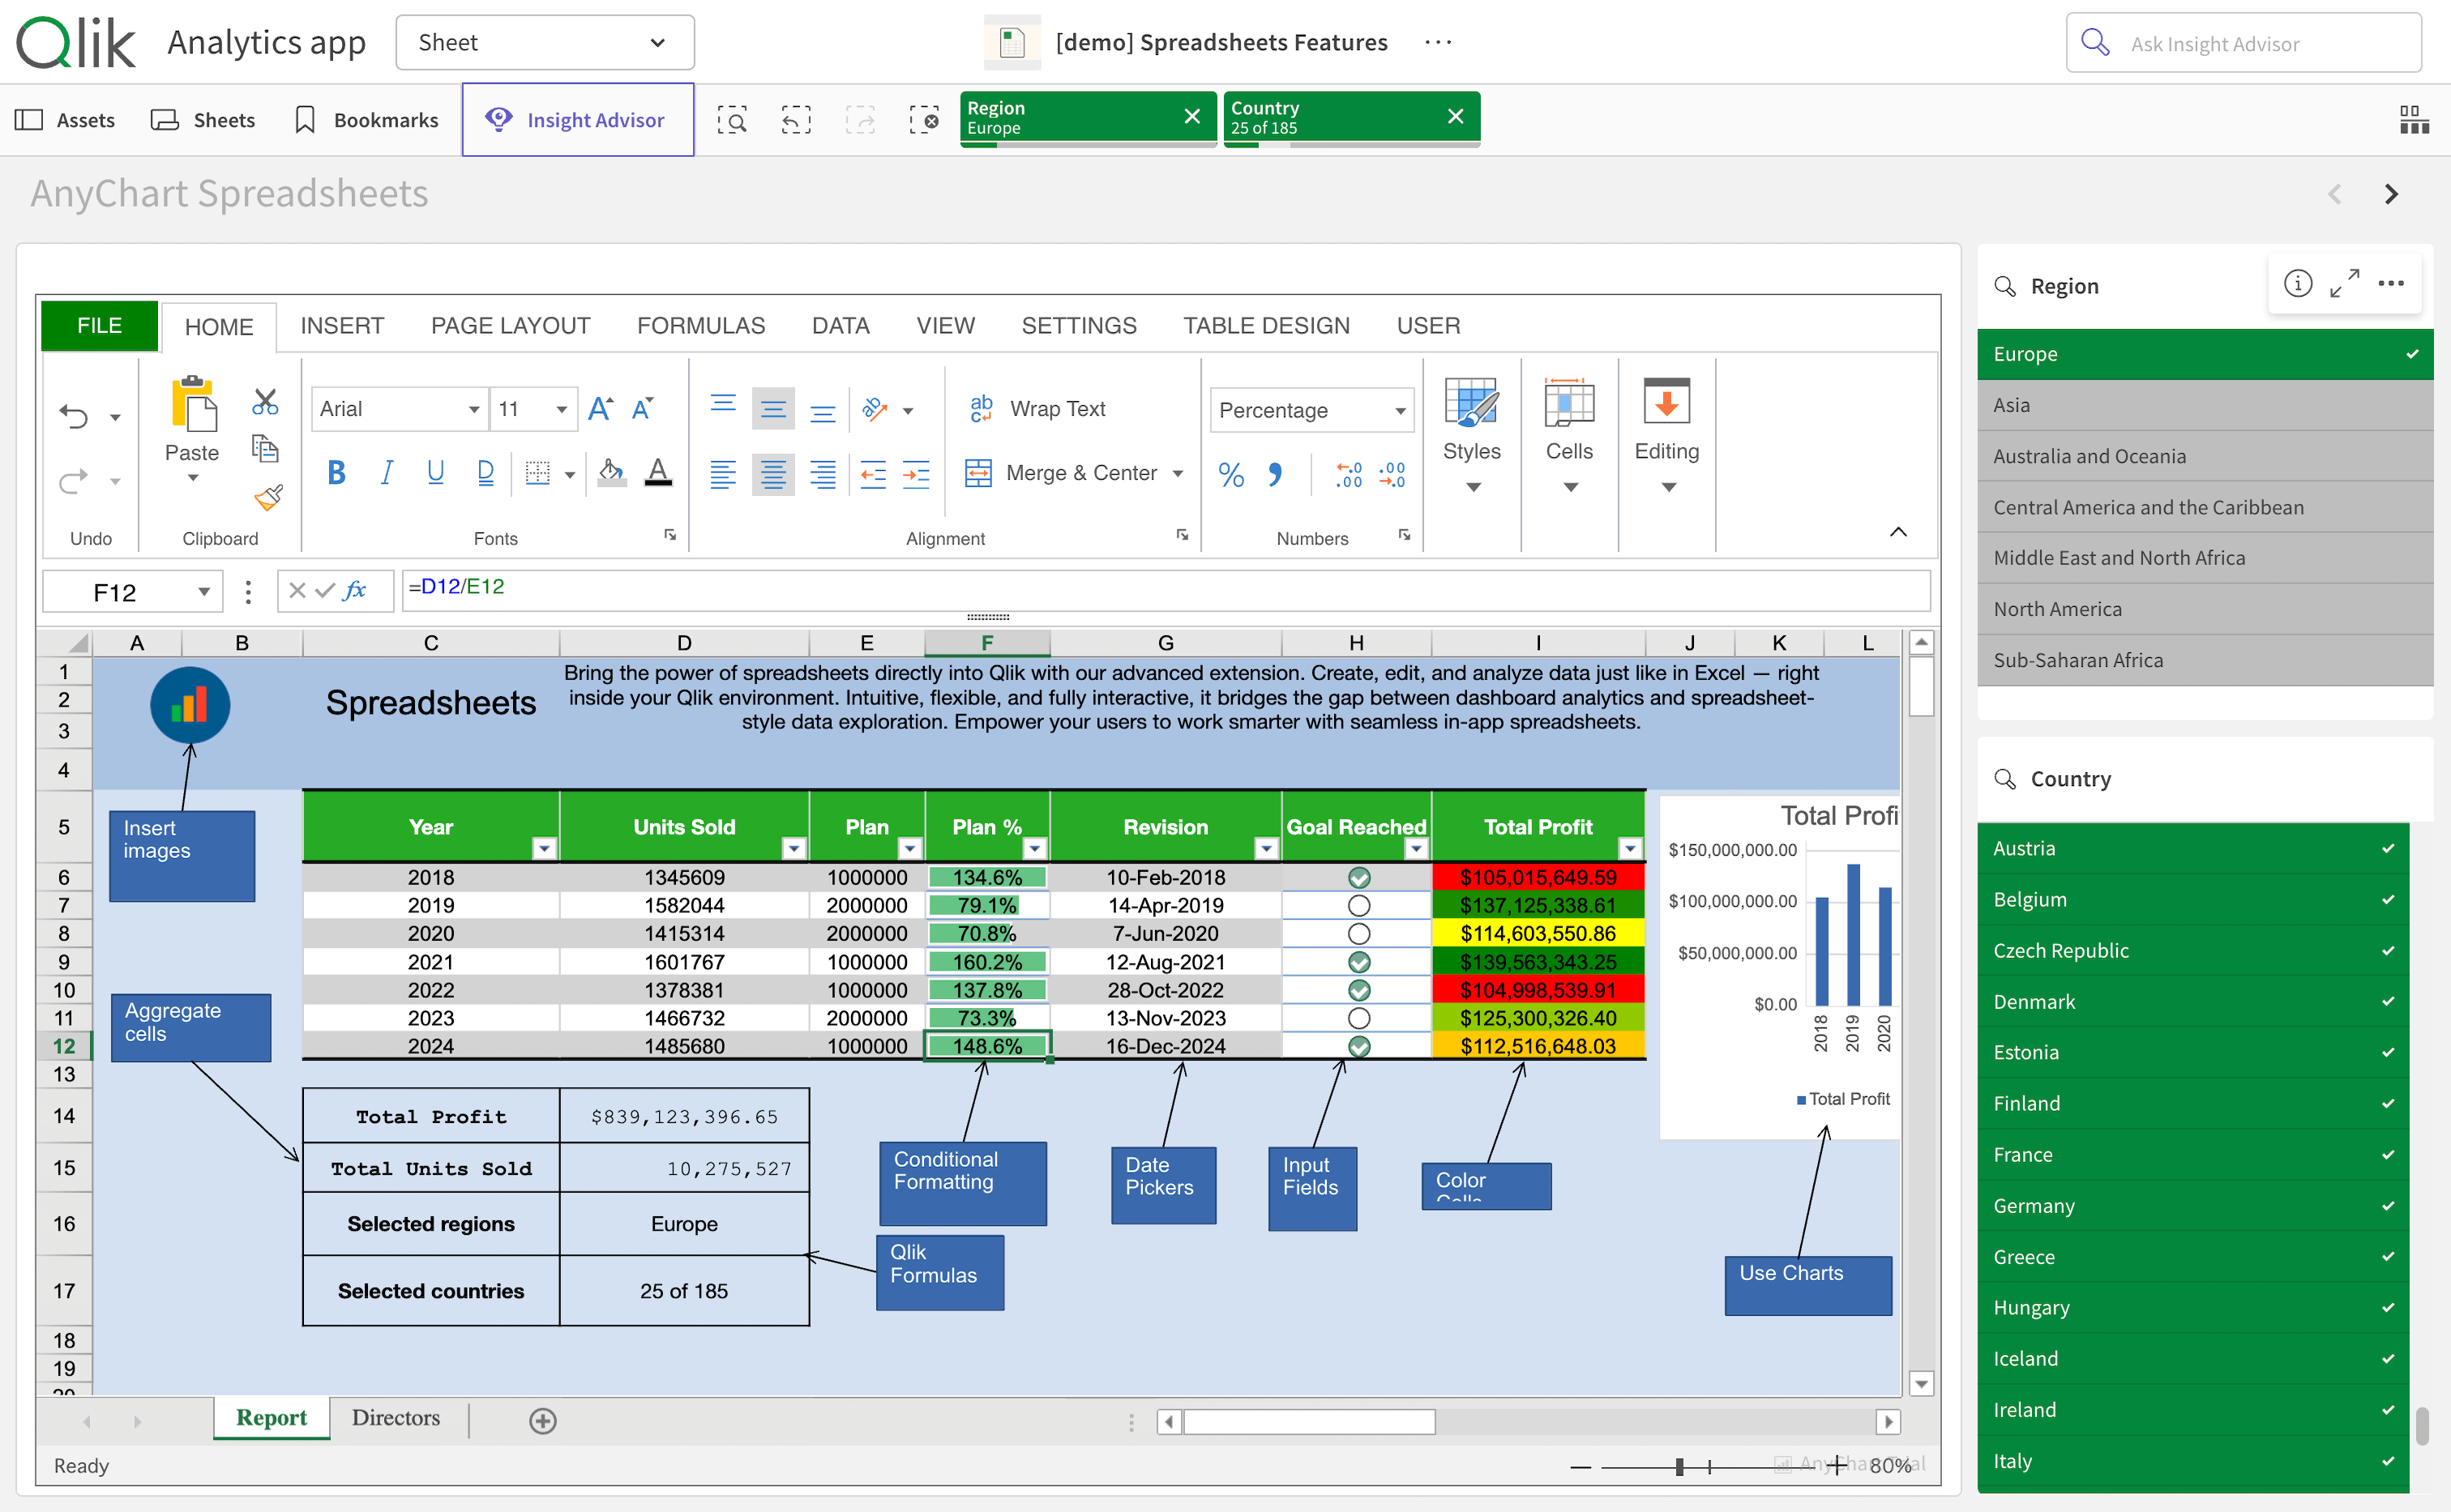
It brings an Excel-style workflow inside Qlik apps, so teams can do spreadsheet work in the same governed context as their Qlik analysis instead of pushing it into side files. The result is fewer detours between dashboards and separate spreadsheets, and less duplicate logic across versions.
The Spreadsheets extension now joins our other solutions for Qlik Sense and Qlik Cloud, our JavaScript charting library, and the rest of the AnyChart portfolio, all built to make working with data through visual interfaces more efficient and effective. In 2026, we will keep building and improving.
Happy Holidays, and thank you for being part of our 2025.