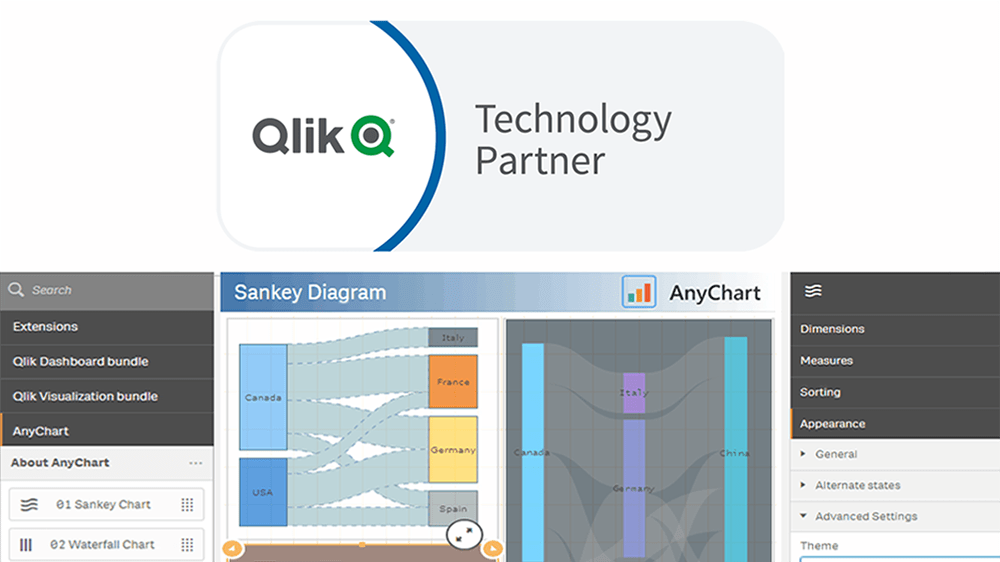
“We’re excited to be partnering with AnyChart, and their extensions will provide customers with additional choices for building even more compelling visualizations.”
— Mike Foster, Vice President, Strategic Partners at Qlik.
(Source: press release as of May 7, 2019.)
AnyChart crosses a new frontier! The vast data visualization capabilities of our award-winning JavaScript charting library, designed primarily for web developers and software engineers, are now available directly to data analysts and BI experts through powerful, flexible, intuitive extensions for Qlik Sense — AnyChart, AnyGantt, and AnyStock!
Taking advantage of over 15 years of AnyChart’s leadership in the data visualization software market, we are happy to grant Qlik users an entirely new set of chart types, each of which can be built stylish in literally three clicks — with the same ease and simplicity one has come to expect from Qlik.
For unique customizations, our chart editor allows changing every aspect of the visualizations to meet the individual needs of every client and every data visualization task, basic or advanced. Chart design, tooltips, axes, labels, interactivity, and other parts can be easily modified on the fly — natively inside the Qlik environment.
Overall, we’ve already delivered 36 chart types to Qlik Sense:
- AnyChart extension features Sankey, Heatmap, Pyramid, Funnel, Mekko, Mosaic, Radar, Quadrant, Tag (Word) Cloud, and a lot more charts that we call basic — for a wide range of data analytics tasks.
- AnyGantt extension brings Gantt charts and Resource charts — for data-driven project and resource management.
- AnyStock extension adds Stock charts with 7 series type options available, including OHLC, Candlestick, Line, Spline, Column, Area, and Spline Area — for insightful analysis of financial and stock market data as well as any other timeline-based data.
On top of that, we have a consistently progressive roadmap of adding even more charts out of the box! In fact, our JavaScript data visualization library supports over 70 chart types and we plan to make all of them available in Qlik Sense. Not to mention our roadmap is also customizable! Any customer can ask us to introduce a certain new chart type or feature and we’ll do our best to add it asap, as we’ve always done. So Qlik users, feel free to get in touch and tell us what you guys actually need for your business and data analysis work — your input greatly matters!
AnyChart’s advanced charting extensions for Qlik Sense are available for download on a 30-day free trial, requiring an appropriate paid subscription to be purchased upon expiration. Licensing is straightforward and completely scalable to the size of the customer business. Additionally, all subscriptions include unlimited upgrades and support at no additional cost.
We are excited to see our extensions have been enjoying enormous interest, considerably expanding our already huge customer base from the very first days live. Actually, it’s explicable as indeed Qlik users never got access to so many built-in charts and features at once, before the advent of AnyChart on the Qlik platform.
From our huge experience in interactive data visualization, we know that better charts lead to better decisions. So we invite all Qlik Sense users, consultants, and business integrators to sign up and cooperate. The AnyChart, AnyGantt, and AnyStock extensions will definitely benefit Qlik’s customers and partners as well as turn out to be greatly advantageous to further development of Qlik itself as a global leader in visual data analytics and business intelligence.
>>> AnyChart’s Extensions for Qlik Sense Data Analytics Tool <<<

