

Microsoft Excel has been declared obsolete countless times. Yet even with the rise of modern BI platforms like Qlik Sense by Qlik, spreadsheets remain central in enterprise analytics. And that is unlikely to change anytime soon.
These two worlds are not rivals; they complement each other. Qlik Sense delivers trusted data, scale, and interactive dashboards. Excel gives formulas, quick checks, and everyday collaboration in an interface everyone knows. Used together, they combine a single source of truth with the familiar flexibility of spreadsheets.
This article provides a comprehensive guide to using Excel with Qlik Sense. We will cover methods from simple exports and imports to advanced integrations such as automated reporting and live connectors. And finally, you'll learn how to embed fully functional spreadsheets directly into Qlik dashboards, completely removing the boundary between Qlik and Excel.
Why Qlik and Excel Belong Together
We touched on this in the introduction, but let’s take a closer look at why Excel continues to be part of the data analytics workflow even in organizations heavily invested in Qlik Sense.
First, adoption. Excel is universal. Its familiarity makes it the easiest on-ramp to Qlik Sense data, lowering training costs and resistance to business intelligence initiatives.
Second, one source of truth. Qlik Sense centralizes definitions and data governance. When Excel outputs are sourced from Qlik (exports, templates, automations, add-ins), teams work from consistent numbers instead of competing spreadsheet versions.
Third, flexible analysis. Qlik Sense dashboards scale and standardize well, but they are not designed for free-form modeling. Excel fills that gap with formulas and functions, scenario testing, and lightweight calculations on top of trusted data.
Fourth, collaboration and distribution. Teams still exchange spreadsheets for review and feedback. Linking them to Qlik ensures shared files reflect consistent numbers while letting people keep their familiar ways of working.
Fifth, efficiency and automation. With templates and scheduled outputs, Qlik Sense can feed Excel directly. This removes manual copy-paste and frees analysts to focus on insights instead of data wrangling.
Sixth, risk control. Qlik Sense enforces security and access rules. Connecting Excel to governed data in Qlik reduces errors, version drift, and spreadsheet sprawl.
Typical scenarios include:
- Monthly KPI packs sourced from Qlik Sense and distributed as Excel files to managers.
- Finance and planning models maintained in Excel but refreshed with Qlik Sense actuals.
- What-if analysis inside Qlik dashboards using full spreadsheets when cell-level editing is required.
Taken together, these factors explain the fit. Qlik Sense delivers governance and scale. Excel preserves agility and everyday usability. Used in combination, they enable reliable decisions without sacrificing speed.
Landscape of Qlik–Excel Solutions
Excel and Qlik Sense can be combined in different ways, depending on the task and level of integration required.
- Data movement. Import Excel files into Qlik Sense as data sources, or export Qlik data back into Excel for reporting and quick analysis.
- Automation. Produce recurring Excel outputs directly from Qlik with the official Excel add-in, NPrinting, or automation tools.
- Live connections. Use third-party add-ins or APIs that let Excel query Qlik data in real time, keeping formulas and models up to date.
- Embedded spreadsheets. Use AnyChart’s Spreadsheets extension to bring full Excel-style functionality directly into Qlik dashboards.
Each approach solves a different need — from quick one-off tasks to enterprise-scale reporting and interactive modeling. In the following sections, we will look at these options in detail, with practical examples of how they work.
Data Movement Between Qlik Sense and Excel
Moving data is the simplest way to combine the tools. You either export Qlik Sense data to Excel or import Excel files into Qlik for analysis alongside central Qlik sources.
How to Export Data from Qlik Sense to Excel

The most basic method is exporting data from a Qlik visualization into Excel. Users can right-click a table or chart and export it as CSV or XLSX. This works well for ad-hoc reporting, quick checks, or compliance snapshots. However, the exported file is static and must be regenerated whenever data updates.
Extensions such as ancoreShare streamline this by enabling one-click exports of entire tables or multi-sheet Excel reports directly from Qlik Sense. These are still snapshots but significantly reduce manual effort.
When to use: ad-hoc checks, offline review, small stakeholder lists.
Strengths: fast, simple, point-in-time snapshots.
Watch-outs: static files; results depend on selections at export.
How to Import Excel Data into Qlik Sense
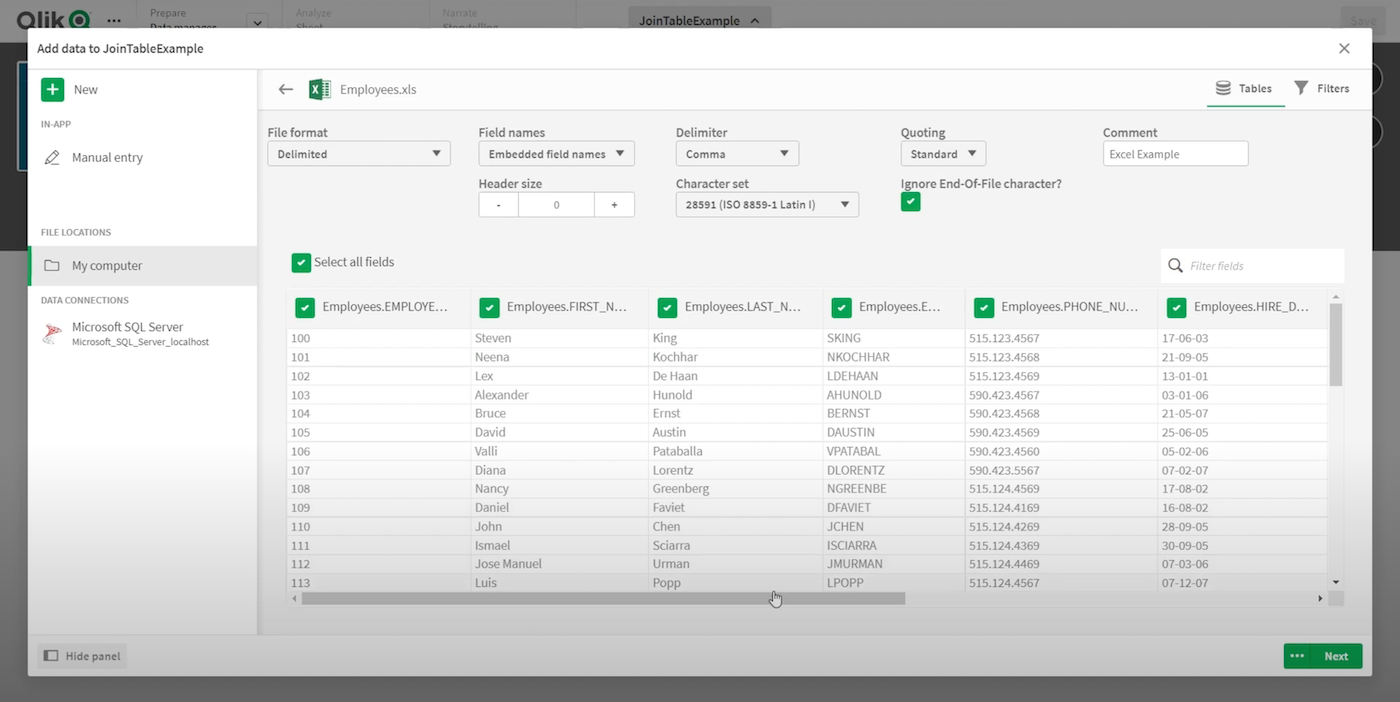
The reverse process is just as important. Excel often happens to serve as the system of record for budgets, forecasts, or operational inputs. Qlik Sense can load Excel files as data sources, letting analysts blend spreadsheet data with central datasets in the associative model.
For many organizations, this is the entry point: analyzing numbers that originated in Excel inside a controlled BI environment.
When to use: team-owned data that lives in Excel but must be combined with enterprise sources.
Strengths: bridges spreadsheets with Qlik analytics, blending operational inputs with centralized data.
Watch-outs: Qlik ingests data only, not formulas, macros, or formatting.
Tips: keep a single header row; avoid merged cells; normalize dates and numbers; store files in governed locations with clear ownership.
Automating Excel Reports
Manual exports work for occasional needs, but many organizations depend on recurring Excel outputs — monthly KPI packs, financial statements, or regulatory reports. Automation ensures consistency, saves time, and keeps outputs aligned with trusted Qlik Sense data.
Qlik Excel Add-in

For users of Qlik Cloud, the SaaS version of Qlik Sense, there is an official Excel add-in that lets you design report templates in Excel and connect them to a Qlik Sense app. Placeholders for tables, fields, or chart images are automatically replaced with data from Qlik when the report runs. Reports can be previewed in Excel, uploaded back to Qlik Cloud, and scheduled for recurring delivery via email or cloud storage.
When to use: recurring templates such as KPI packs, financials, or regulatory submissions.
Strengths: governed data in Excel; flexible template design with text, tables, and visuals; automated refresh and distribution.
Watch-outs: Qlik Cloud only; one app per template; focused on structured reporting, not interactive analysis.
Qlik NPrinting
For on-premises or client-managed Qlik Sense environments, Qlik NPrinting is the standard tool for generating and distributing Excel reports. It allows developers to create Excel templates with placeholders for Qlik data and then schedule outputs or trigger them by event. Distribution can be tailored: reports can be sent by email, saved to shared folders, or published to portals, with different content for different recipients.
When to use: enterprise reporting at scale — complex KPI packs, department workbooks, compliance bundles.
Strengths: mature product; flexible distribution (email, folders, portals); supports “bursting,” sending customized reports to multiple recipients.
Watch-outs: separate licensing and infrastructure; setup and maintenance overhead; designed for scheduled reporting, not interactive use.
Other Automation Tools

Beyond Qlik’s native options, lightweight automation can be achieved with workflow platforms such as Qlik Automate (known as Qlik Application Automation until June 2025) or Microsoft Power Automate. These tools can refresh or distribute Excel files stored in OneDrive, SharePoint, or similar repositories on a schedule or in response to an event trigger.
Extensions like ancoreShare can also plug into such automation pipelines, enabling scheduled Excel exports without requiring a full NPrinting deployment.
When to use: simple recurring exports where full reporting tools (like NPrinting) are overkill.
Strengths: quick setup; integrates with cloud storage and collaboration tools; cost-effective for basic needs.
Watch-outs: limited flexibility for complex formatting; not designed for large-scale distribution.
Live Connections Between Qlik and Excel
Sometimes users need more than scheduled outputs — they want to stay in Excel but work with live Qlik data. This lets analysts refresh models and pivot tables with trusted data on demand, without relying on static exports.
Third-Party Add-ins
Tools such as AnalyticsGate (formerly Sense Excel) provide Excel add-ins that connect workbooks to Qlik Sense. These add custom functions into Excel — for example, a formula in a cell can pull the sum of sales for a given region directly from a Qlik app. Data refreshes on demand, and in many cases, Qlik selections are respected within Excel.
When to use: financial models, forecasts, or complex Excel workbooks needing central Qlik data.
Strengths: real-time refresh capability; keeps Excel’s familiar flexibility; avoids manual exports.
Watch-outs: requires third-party licensing; performance depends on query size and server capacity.
Custom API Integrations

For specialized cases, organizations can develop their own connectors using Qlik’s REST and Engine APIs (see Qlik.dev and the developer help). Scripts or applications can query Qlik and populate Excel programmatically, even embedding data into VBA macros or bespoke models.
When to use: niche workflows where off-the-shelf add-ins do not fit.
Strengths: maximum flexibility; can match internal security and governance policies.
Watch-outs: development and maintenance overhead; slower to implement.
Embedding Excel Spreadsheets in Qlik Sense
Previous methods either move data back and forth or keep Excel connected as an external tool. Instead of such workarounds, embedded spreadsheets bring the full spreadsheet environment directly into Qlik Sense.
AnyChart’s Spreadsheets Extension

Introduced at Qlik Connect 2025, AnyChart’s Spreadsheets extension embeds an Excel-style grid inside dashboards, enabling true cell-level editing within Qlik’s BI environment. Users can enter or update data, apply formulas and functions, test scenarios, format cells, and create visualizations, including sparklines and full charts — all with the familiarity of Excel.
Workbooks can also be imported in XLSX or CSV as a starting point and exported back in XLSX, CSV, or PDF when needed, with structure and styling preserved. Because spreadsheet objects are tied to Qlik’s associative model, they respond dynamically to Qlik selections, remain consistent with applied filters, and stay aligned with all other visualizations in the app.
Keeping spreadsheet work inside dashboards reduces uncontrolled exports to Excel and encourages broader adoption of Qlik across the organization.
When to use: planning, budgeting, forecasting, what-if modeling, or data entry processes where teams need spreadsheet-style editing inside Qlik dashboards.
Strengths: combines spreadsheet freedom with BI consistency; supports formulas, functions, charts, and import/export; interactive, scenario-ready, responsive to Qlik selections.
Watch-outs: tailored for spreadsheet-style workflows, not for enterprise-scale reporting or bulk scheduled distribution.
Choosing Best Way to Integrate Qlik and Excel Workflows
Each method has its place in the workflow:
1. Quick tasks → move data between Qlik Sense and Excel with native export or tools like ancoreShare.
2. Recurring reports → automate delivery with the Excel add-in in Qlik Cloud or with NPrinting on-premises.
3. Process automation → schedule refreshes and file updates through tools like Qlik Automate or Power Automate.
4. Excel-centric analysis → connect directly to Qlik data with live add-ins such as AnalyticsGate or custom APIs.
5. Excel-like spreadsheets inside Qlik → embed editable, formula-ready spreadsheets directly in dashboards with AnyChart Spreadsheets, keeping the familiar feel of working in Excel (or Google Sheets).
Together, these categories form a practical framework covering everything from one-off exports to fully integrated spreadsheet workflows within Qlik Sense.
Best Practices for Combining Qlik Sense and Excel
To make the most of Qlik and Excel together, focus on a few guiding practices:
1. Keep Qlik as the source of truth.
Qlik Sense should own governed data, definitions, and access rules. Excel files — whether exports, automated outputs, or embedded spreadsheets — must always pull from that trusted layer.
2. Use Excel for agility, not scale.
Dashboards and heavy calculations scale better in Qlik. Excel is best for quick checks, formulas, or scenario modeling. With extensions like AnyChart Spreadsheets, some of this agility can even happen directly inside Qlik dashboards.
3. Automate and standardize.
Manual copy-paste is risky. Use add-ins, NPrinting, or automation tools to refresh spreadsheets consistently. Reusable templates reduce errors and keep outputs aligned across teams.
4. Control distribution.
Untracked email chains create version chaos. Where possible, distribute reports through central folders, portals, or automation pipelines.
Conclusion
As 90% of organizations continue to use spreadsheets for critical business data, Microsoft Excel remains deeply embedded in business workflows. Qlik Sense complements rather than replaces it, adding governance, scale, and interactive analytics to the familiarity and flexibility teams already rely on.
Exports and imports handle quick exchanges of data. Automation and live connections keep Excel spreadsheets synchronized with current Qlik data. Embedded spreadsheets go further by making the full spreadsheet experience part of the dashboard itself — the only way to remove the boundary between Qlik and Excel entirely.
This completes the picture of how Qlik and Excel can be linked — so every organization can balance governed analytics with the agility of spreadsheets in a single workflow.