
QlikWorld Conference 2023
AnyChart at QlikWorld 2023
Booth #180 at QlikWorld
Mandalay Bay, Las Vegas, NV
April 17–20, 2023
QlikWorld Conference Returns in Person
For the first time in almost four years, the QlikWorld Conference will bring together Qlik leaders, partners, customers, influencers, and enthusiasts from all over the globe in person. The event promises an exceptional blend of visionary keynotes, interactive best-practice sessions and workshops, showcases of the latest innovations, and networking with peers and vendors. All these will help you discover how to leverage visual data analytics to fuel your business growth.
The AnyChart team will be present at QlikWorld 2023 from the event's first day to its last. We will take this opportunity to present our latest developments, providing you with powerful new ways to analyze your data and make informed decisions quickly. Our Decomposition Tree, Gantt Chart, Combo Chart, and many other extensions for Qlik Sense will be in the spotlight, and we would love to demonstrate them to you. Come meet us in Booth #180!
Elevate Your Data Analytics with New Top-Notch Visuals
This year, AnyChart has been awarded the best technology for data analytics and visualization. Join us at QlikWorld to experience how you can enhance your Qlik Sense dashboards and apps with our cutting-edge solutions now ported to the Qlik platform as intuitive extensions!


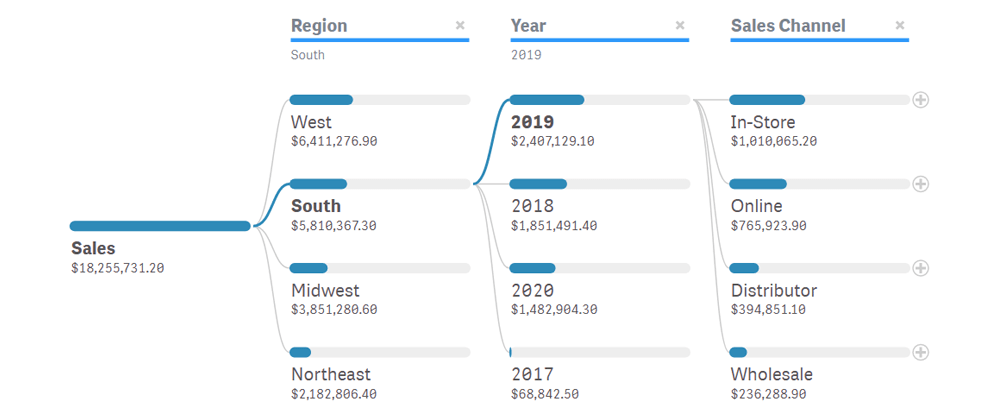
Decomposition Tree
Visualize data across multiple dimensions in an efficient manner with our Decomposition Tree extension for Qlik Sense. With its granular data presentation, it's ideal for ad hoc exploration and root cause analysis, and it comes with built-in features that allow you to adapt the chart to your data and goals. This is the only way to add decomposition trees to your Qlik Sense apps.
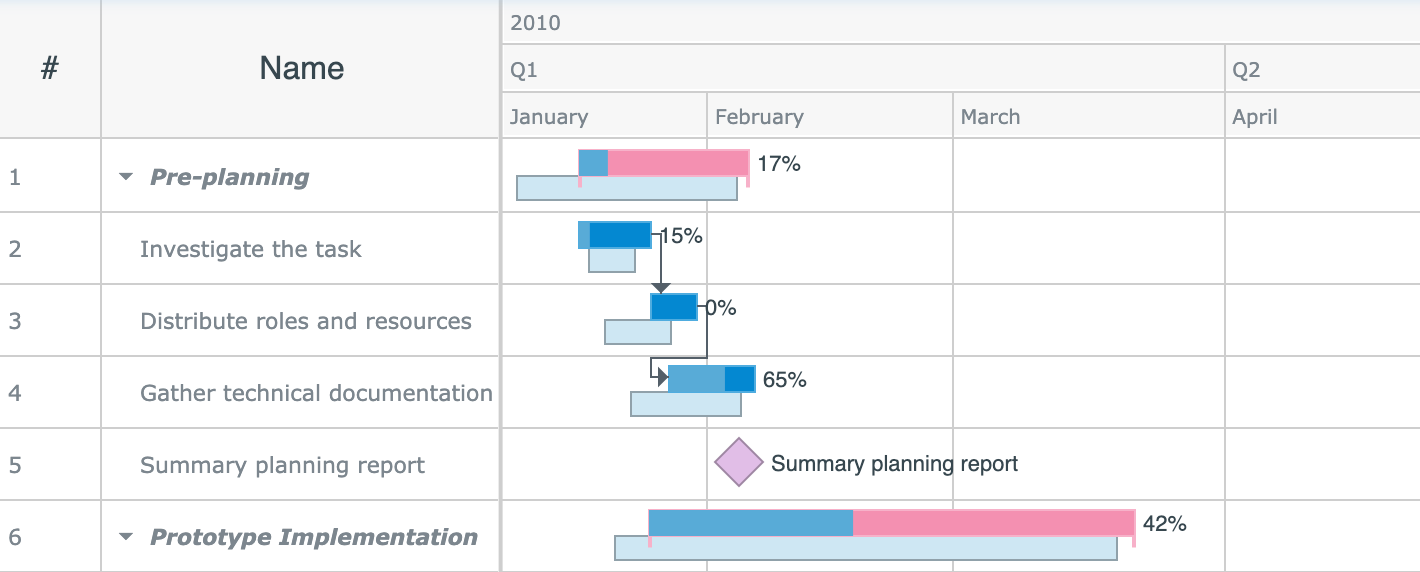
Gantt Chart
Take your project management to the next level with the help of Gantt charts, now easily buildable with the help of our extension for Qlik Sense. The flexible settings for the timeline, activity bars, milestones, dependency connectors, and many other options add up to the best user experience. A separate solution for resource allocation is also available!
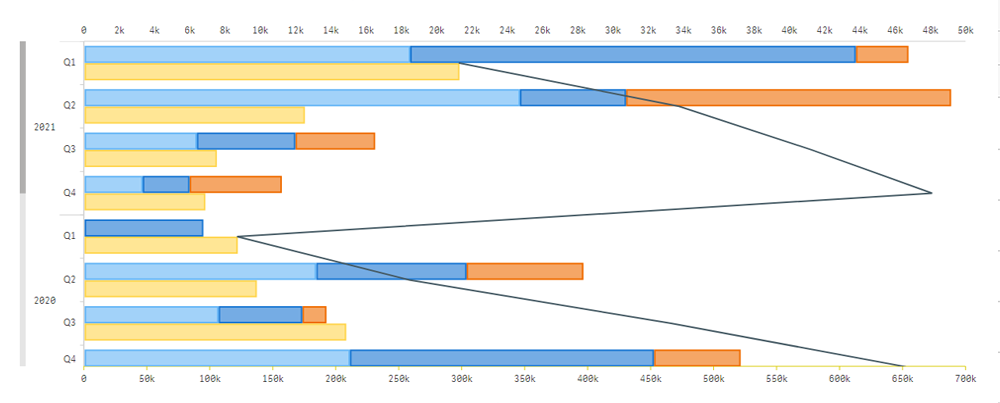
Combo Chart
Quickly spot correlations that might exist between any two values that differ in scale over time or by category using our Combo Chart extension for Qlik Sense. With a wide variety of chart types, error bars, up to three dimensions, and other game-changing features, it provides unprecedented flexibility for trend analysis in Qlik Sense.