
Organization Overview
Organization Overview


About this app
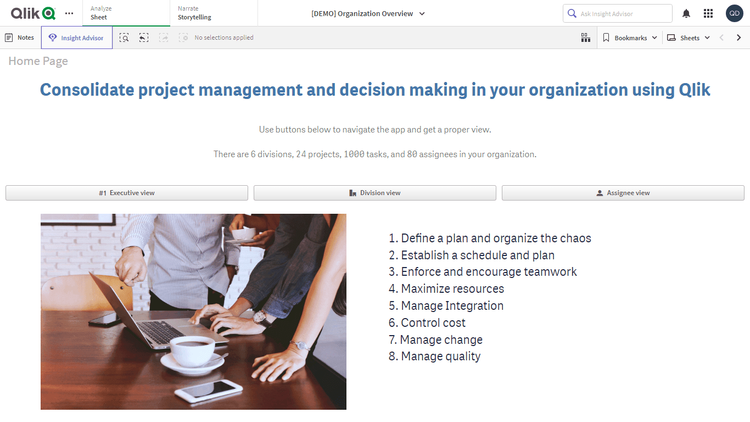
Check out a brilliant way to consolidate project management and decision-making in your company or organization using Gantt charts in Qlik Sense. Imagine you have scores of employees across multiple departments — and thousands of tasks across various projects. Now, enjoy a comprehensive overview of the entire work at a glance! With the ultimate effectiveness and efficiency, perform project planning and scheduling, and keep all processes on track.
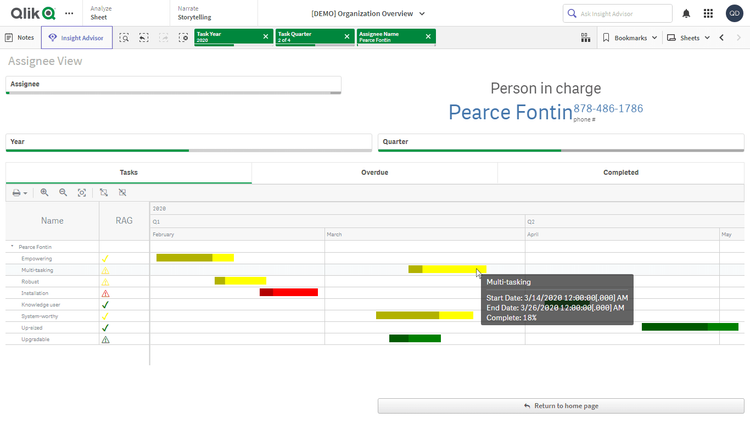
This application features Project Gantt Charts built with the Gantt Chart extension for Qlik Sense. The dataset is fictional.
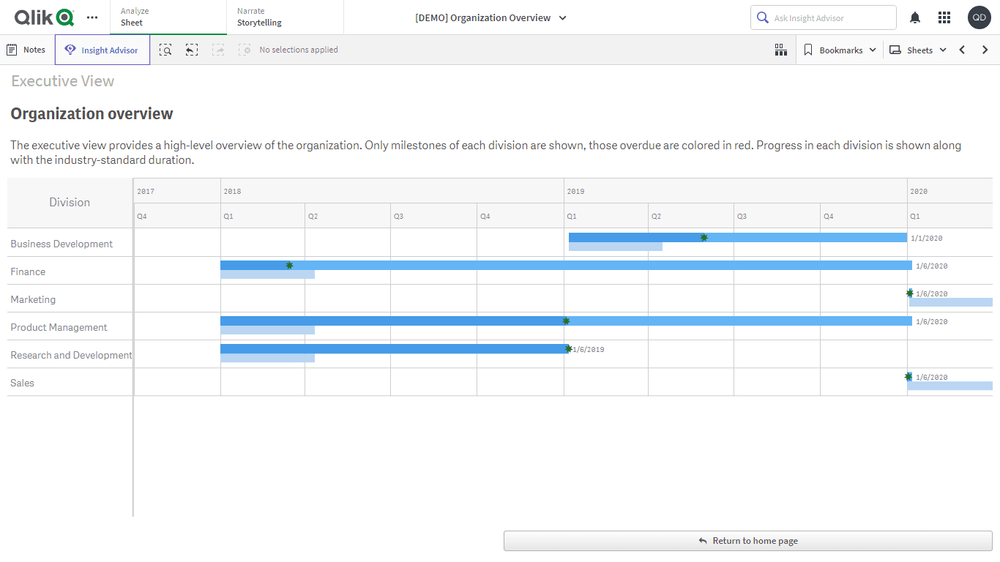
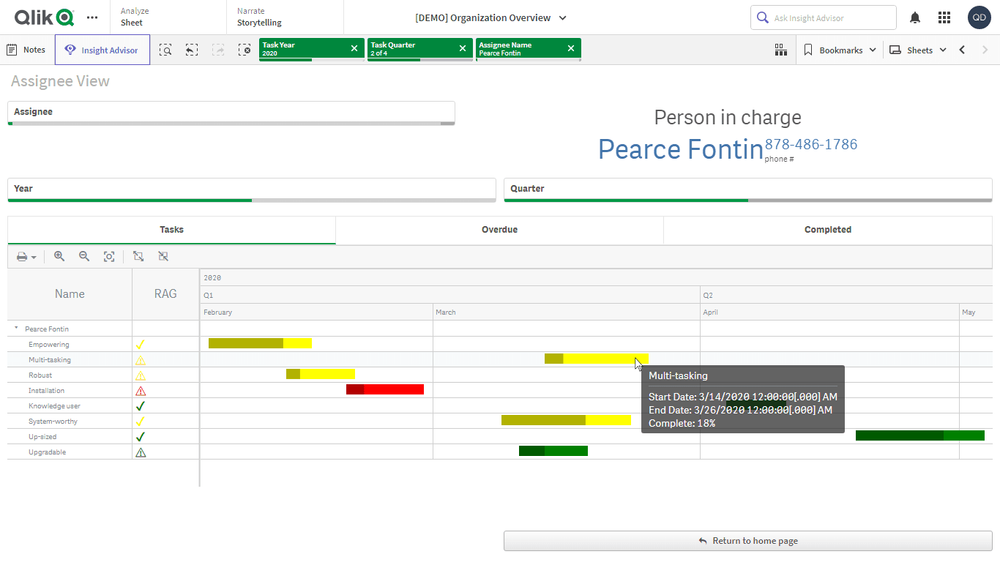
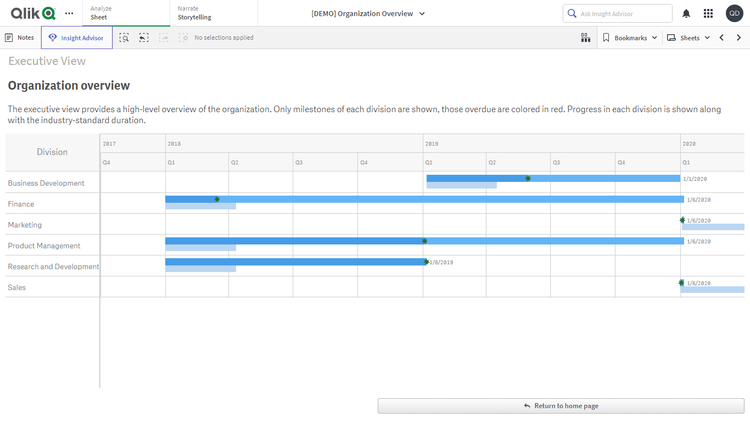
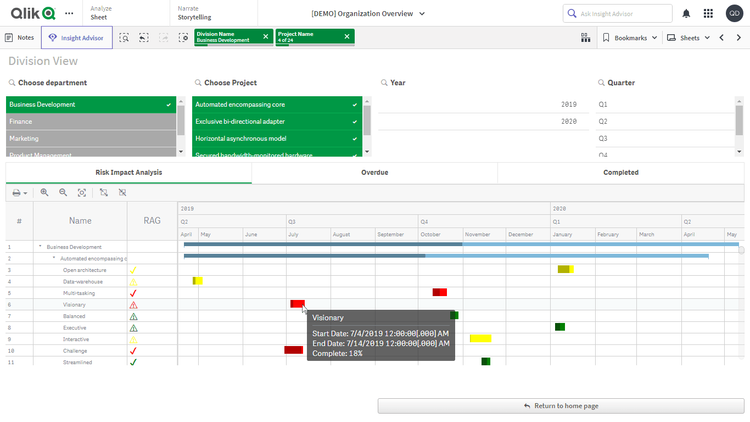
The app arranges the data in three major views. The Executive view provides a high-level overview of the organization by visualizing the performance of the divisions (departments). The Division and Assignee views provide the respective details.
- Define a plan and organize the chaos
- Establish a schedule
- Encourage teamwork
- Maximize resources
- Manage integration
- Control costs
- Manage changes
- Manage quality