Premium Qlik Apps, Extensions, Mashups &
Data-Driven Experiences
From initial concept to full implementation, AnyChart delivers bespoke Qlik solutions engineered to match your organisation’s specific requirements, scale, and vision. Whether you need advanced mashups, fully customised applications, or enterprise-grade Qlik Sense extensions, our team ensures a seamless, high-quality result.
Core Expertise
Operating as an official Qlik Technology Partner, with proven expertise since 2014, delivering over 200 UX projects for analytics across 14 countries on 4 continents.
"Delivering fully custom, white-label web applications powered by Qlik (using React, Enigma.js, Capability API, and AnyChart extensions) to create seamless, branded interfaces that go far beyond native Qlik dashboards."
- SaaS or On-Premises Integration
- Mobile + Web Responsive Design
- Advanced Interactivity
- AI-powered UX enhancements and intelligent data interactions
Custom Mashups
Tailor-made web applications that seamlessly integrate Qlik analytics.
Mobile First
Fully responsive designs ensuring your data is accessible anywhere, on any device.
Premium UX/UI
High-fidelity interfaces that drive adoption rates up to 400%.
Modern Stack
React, Enigma.js, and open-source libraries for robust solutions.
Proven Projects with Qlik
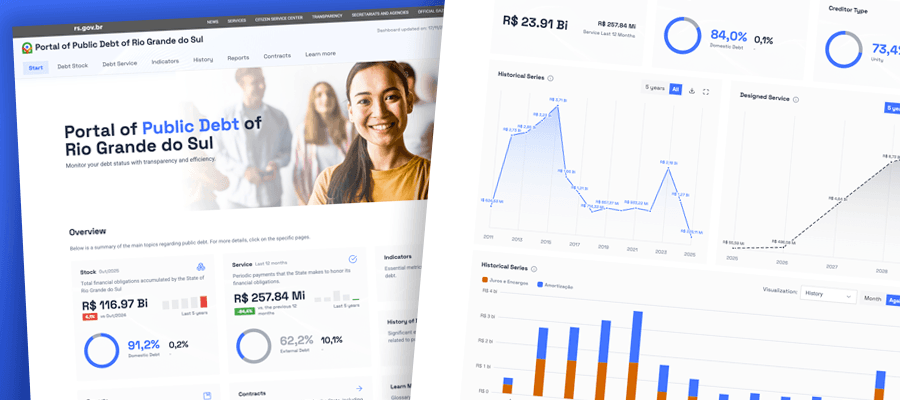 PUBLIC SECTOR
Governement Reporting
BRAZIL
Public Portal: 100% custom Qlik Sense mashup (On-prem/Cloud), Figma-designed institutional UI, Nebula.js + React custom charts and filters, fully responsive mobile & desktop powered by Enigma.js.
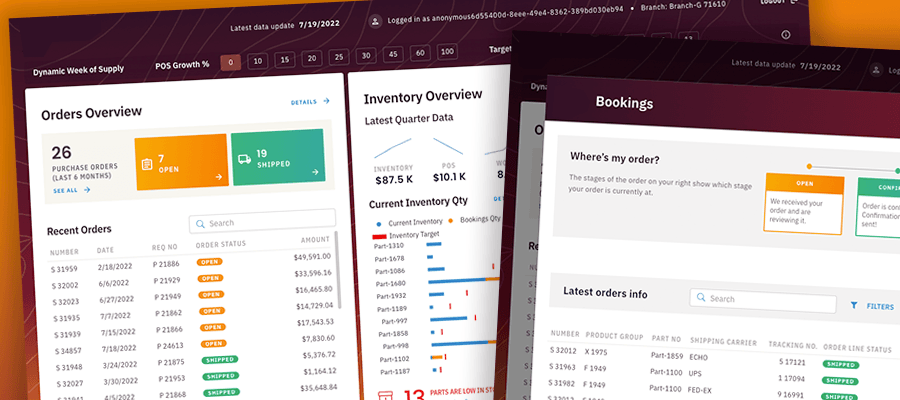 ENERGY
Energy Supply Portal
USA
Energy Supply Chain Portal: custom Qlik Sense mashup for energy sector, desktop-optimized inventory & purchase order management, Nebula.js + React custom visuals, real-time stock levels, open orders and low-stock alerts.
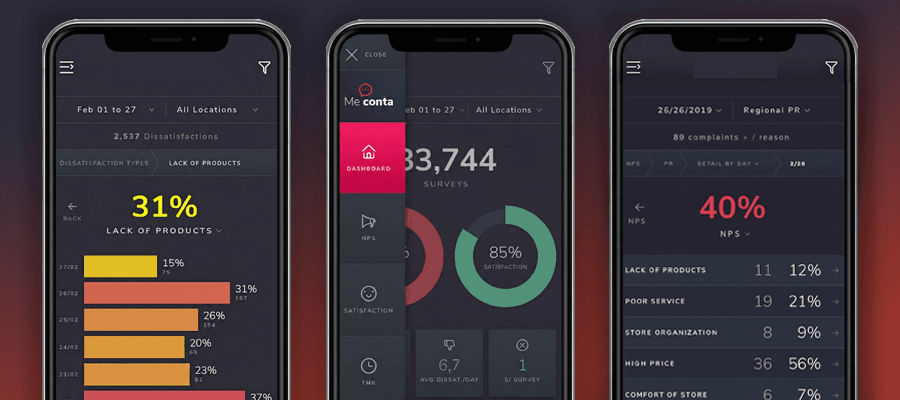 RETAIL
Retail Chain
BRAZIL
Custom Qlik Sense mashup for the fashion retail sector, mobile-responsive design for nationwide store managers, real-time NPS & Customer Satisfaction monitoring, granular dissatisfaction root-cause analysis, and daily operational KPI tracking.
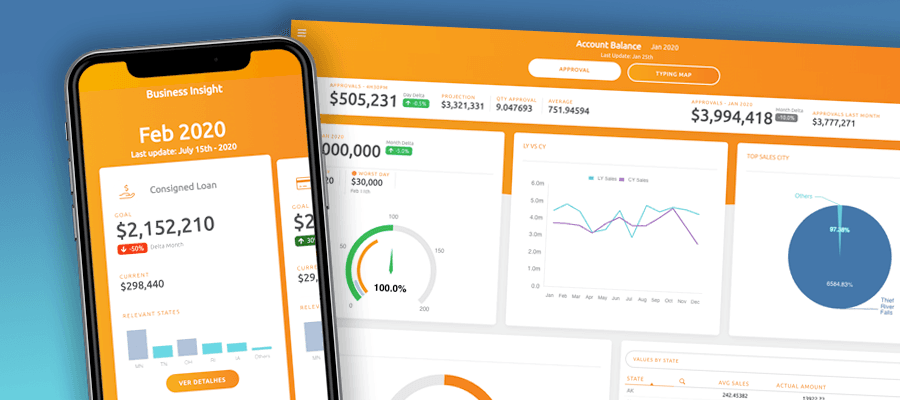 FINANCE
Large Bank
BRAZIL
Custom analytics solution leveraging Qlik Sense, Nebula.js and Enigma.js, engineered for seamless cross-platform access across laptops, tablets, and smartphones. Provides executives with real-time visibility into corporate goal attainment and high-level strategic KPI monitoring.
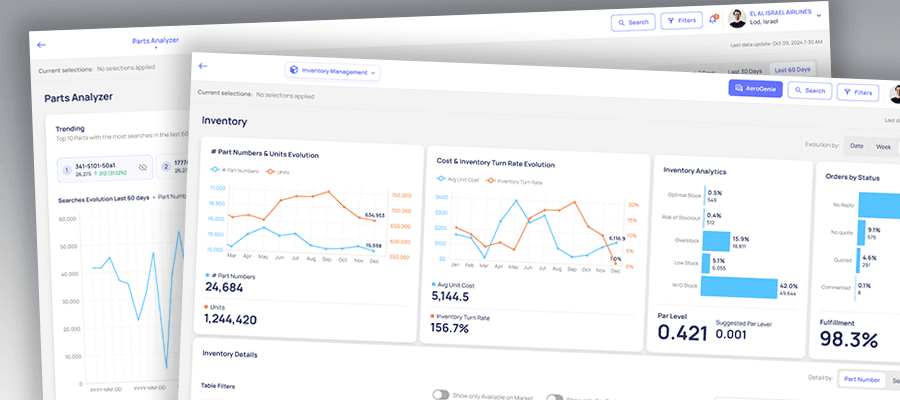 AVIATION
Aviation Industry
USA
Custom Qlik Sense mashup developed with React, Enigma.js, and Nebula.js. Designed in Figma for intuitive UX, enabling global tracking of aftermarket sales, SKU inventory levels, and order fulfillment performance across international markets.
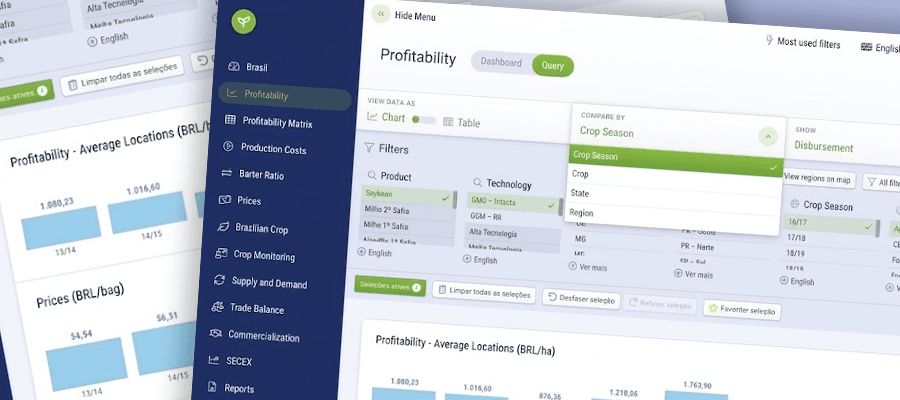 AGRICULTURE
Agricultural Company
BRAZIL
Multilingual Qlik mashup built with React, Enigma.js, and Nebula.js. Features dynamic subscription-based access control, automatically adjusting custom filters and data visibility according to user plans for optimised global harvest monitoring.
Proven App Development Process
A structured approach to delivering high-quality analytics products.
Design & Research
User interviews, business value definition, info architecture.
Prototypes
Low-Fi wireframes & High-Fi full branding visual polish.
Web Development
100% custom React solution, fully interactive.
Deployment & Go-Live
Configuration, knowledge transfer, production rollout.
Why Choose These Services?
Combining technical excellence with design thinking to unlock the true potential of data.
Start Your ProjectHighest UX/UI Standards
Premium UX/UI within the Qlik ecosystem.
Dramatic Adoption Increases
Up to 400% documented increase in user adoption.
Global Expertise
Battle-tested in USA, Canada, Brazil, Israel, Italy, Croatia and Australia.
Official Partner
Deepest expertise.
The project examples presented here originate from both AnyChart’s internal work and selected partner contributions. They reflect the overall quality and approach we bring to UX, design, and Qlik engineering engagements.