Version 2.x History
AnyChart Qlik Extensions version 2.6.0
Released Nov, 2018
Sankey Chart
A Sankey diagram, or chart, named after Captain Matthew Sankey, is a flow diagram that shows nodes linked by flows, the quantity of each flow being represented as its width. This chart type emphasizes the major transfers or flows within a system and helps to locate dominant contributions to an overall flow.
Reset to default settings
User interface extended with reset buttons that allow to reset settings to default values. It can be done on an exact input field and on the whole setting panel level.Improvements:
- Updated inputs with function values behaviour
- Fixed bug in custom scale panels
AnyChart Qlik Extensions version 2.5.0
Released Oct, 2018
Tag Cloud
A tag cloud, otherwise known as a word cloud or weighted list, is a visual representation of text data. This chart is typically used to show keyword metadata (tags) on websites, or to visualize free form text. Tags are usually single words, and the importance of each tag, which is often based on its frequency, is shown with font size or color.Improvements:
- Improved data fetching mechanism.
AnyChart Qlik Extensions version 2.4.1
Released Jun, 2018Improvements:
- Added 'Export to PDF' and 'Export as an image' functionality support
Bug fixes:
- Fixed series names (labels) update bug
AnyChart Qlik Extensions version 2.4.0
Released Jun, 2018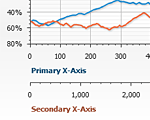
Multiple scales for axes and series
Additional scales of Ordinal, Linear, Logarithmic and DateTime type can now be used. Scales can be set to series, grids and other objects. You can also configure the default chart scale.
Localization Support
Anychart Qlik Extension now supports full localization of input and output date/time and number formats, based on the AnyChart locale mechanism. Learn more about localization here.
Falling/Rising coloring controls for Waterfall and OHLC series
Total/falling/rising colors can now be configured for waterfall, candlestick and ohlc series.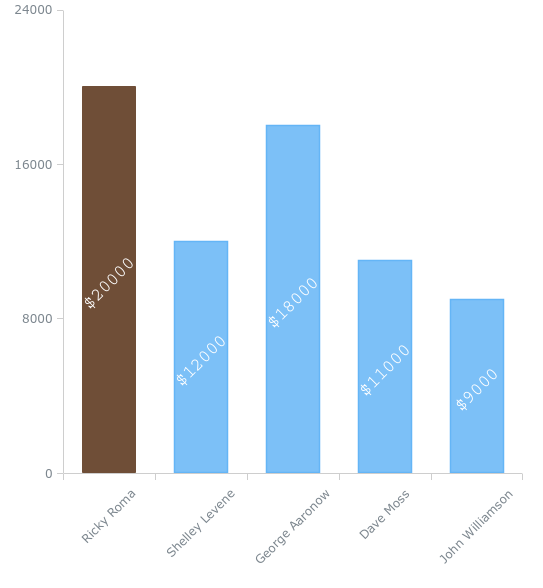
Labels rotation settings
Series and axes labels can now be rotated.AnyChart Qlik Extensions version 2.3.0
Released Feb 27, 2018
Linear Gauges
The Linear Gauge is a visualization of tools with a linear scale, such as thermometers, tanks, color indicators (LED), and so on. Data values can be displayed on a linear gauge axis with the help of pointers, markers, or ranges.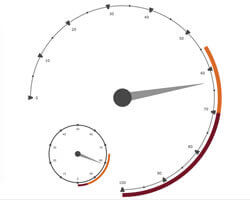
Circular Gauges
A Circular Gauge is a type of gauges with a radial scale such as speedometer, ammeter, voltmeter etc. The specified value is displayed on Circular Gauge axis using a pointer or a marker or a range.New features:
- Data Field Tokens
- Series Name from data
- Multidimensional Behavior
AnyChart Qlik Extensions version 2.2.0
Released Dec 20, 2017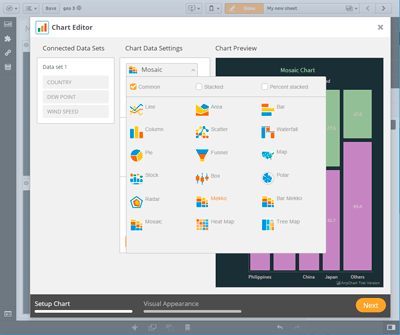
New Chart Type Select Control
New Chart Type Select Control provides an easy, convenient way to select chart type in Chart Editor interface. It gives you an ability to utilize all power of filters and chart preview images.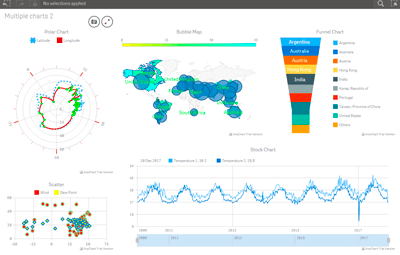
AnyChart Qlik Demo Application
AnyChart Qlik Demo Application is a anychart-qlik-demo-application.qvf file which contains several sheets with all chart types available in AnyChart Qlik Extension. This Demo Applications files allows you to learn all the power of AnyChart Charts in combination with Qlik Data Analytics Platform.New chart types:
AnyChart Qlik Extensions version 2.1.0
Released Nov 27, 2017New chart types:
Improvements:
- Added Pie Chart specific setting tab
- Added config.js file with Qlik measures and dimensions settings
Bug fixes:
- Fixed bug with DateTime text formatting
- Fixed bug when Chart Editor don't receive more than 6 measures
AnyChart Qlik Extensions version 2.0.1
Released Nov 16, 2017New chart types:
Improvements:
- Series now inherit their names from the measure labels
- Now you can use measures label as dataset field names
- Added ability to set data label position settings
AnyChart Qlik Extensions version 2.0.0
Released Nov 3, 2017New chart types:
New features:
- Chart Title settings
- Data Points Labels settings
- Series settings
- Grids settings
