QlikWorld Tour 2023
Join AnyChart at QlikWorld Tour — Expand Your Data Horizons
Engage with Qlik and our latest extensions for Qlik Sense. Be the first to meet AI-powered YODA — Your Own Documents Assistant.Why Attend QlikWorld Tour?
QlikWorld Tour is an unmissable global roadshow meticulously crafted to broaden your data horizons. You'll have the exclusive chance to participate in enlightening sessions, get inspired by compelling customer stories, and explore the latest innovations in Qlik analytics. Prepare to gain invaluable insights into the present and future of data, analytics, and AI, equipping you with the confidence to conquer your data challenges like never before!
As a proud sponsor of QlikWorld Tour 2023, AnyChart will have our top representatives in Dallas, New York, San Francisco, and Atlanta. We are excited to showcase our latest developments, offering powerful new ways to analyze data and make informed decisions quickly. Be captivated by the spotlight on our cutting-edge extensions for Qlik Sense like Decomposition Tree and Gantt Chart, as we personally demonstrate their exceptional capabilities.
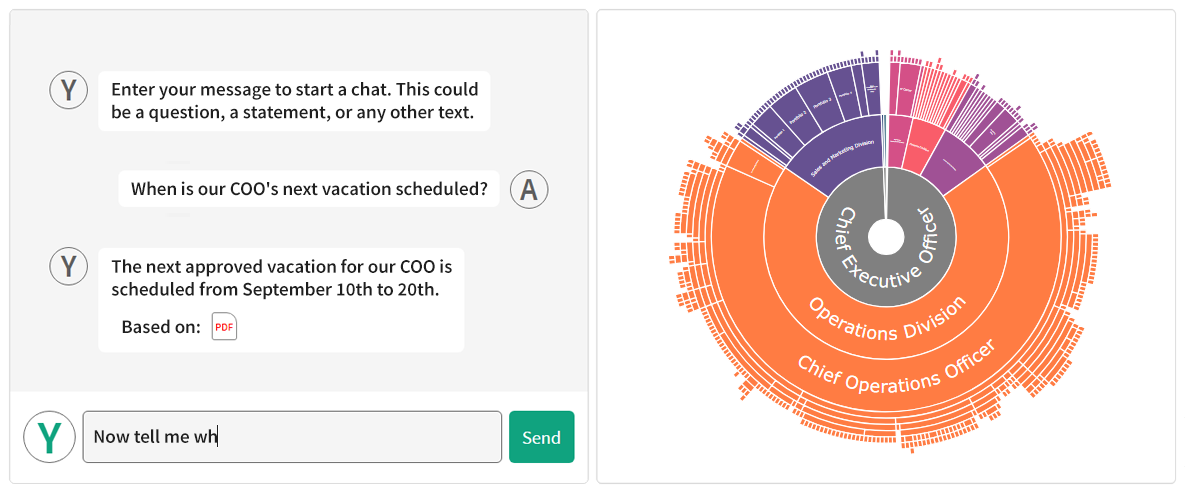
And the cherry on top: You'll witness the groundbreaking YODA — Your Own Documents Assistant unveiled during QlikWorld Tour 2023! Be among the very first to experience the AI-powered magic of naturally speaking with your documents right in your Qlik Sense apps, unlocking invaluable context for your data on the fly.
Come meet us at QlikWorld Tour and embark on a transformative data analytics journey!
Elevate Your Data Analytics with AI and New Top-Notch Visuals
This year, AnyChart has been awarded the best technology for data analytics and visualization. Join us at QlikWorld Tour to experience how you can enhance your Qlik Sense dashboards and apps with our cutting-edge solutions now available on the Qlik platform as intuitive extensions!


YODA — Your Own Documents Assistant
Augment your Qlik reports with intelligent conversations! Our newest, AI-powered YODA extension for Qlik Sense lets you seamlessly interact with any source or supplementary documents, asking questions and receiving answers as if consulting a human assistant. Conversations flow smoothly through an intuitive chat UI right within your apps, unlocking invaluable context for your data and simplifying your decision-making like never before.
Decomposition Tree
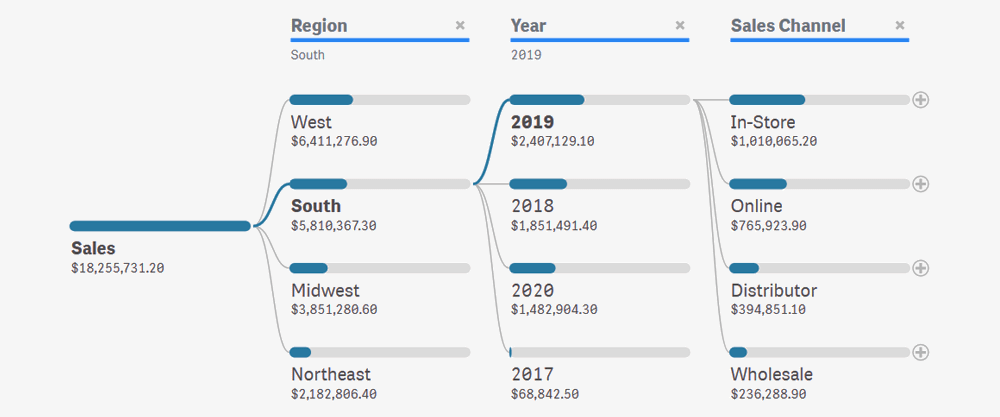
Visualize data across multiple dimensions in an efficient manner with our Decomposition Tree extension for Qlik Sense. With its granular data presentation, it's ideal for ad hoc exploration and root cause analysis, and it comes with built-in features that allow you to adapt the chart to your data and goals. This is the only way to add decomposition trees to your Qlik Sense apps.


Gantt Chart
Take your project management to the next level with the help of Gantt charts, now easily buildable with the help of our extension for Qlik Sense. The flexible settings for the timeline, activity bars, milestones, dependency connectors, and many other options add up to the best user experience. A separate solution for resource allocation is also available!
