
テック業界レイオフ
この Qlik Sense デモアプリでは、分解ツリーとコンボチャートを用いてテック業界のレイオフに関するインサイトを提供します。AnyChart 拡張機能による Qlik 分析をお楽しみください。
テック業界レイオフ


このアプリについて
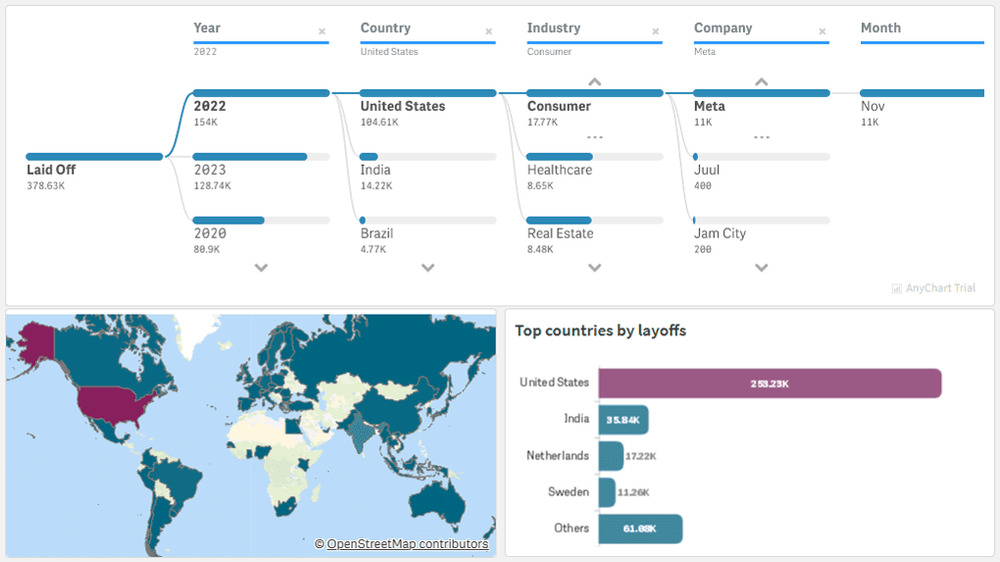
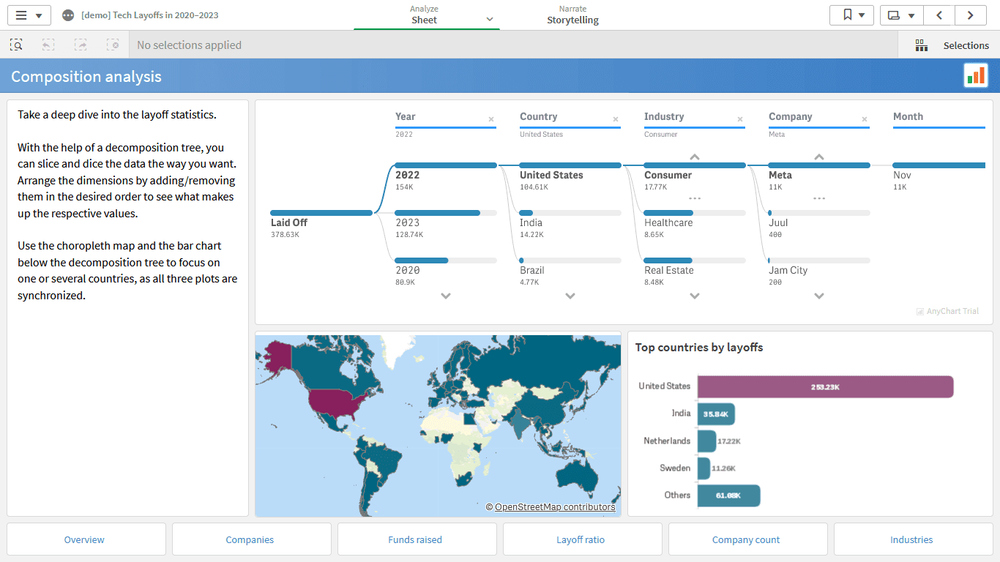
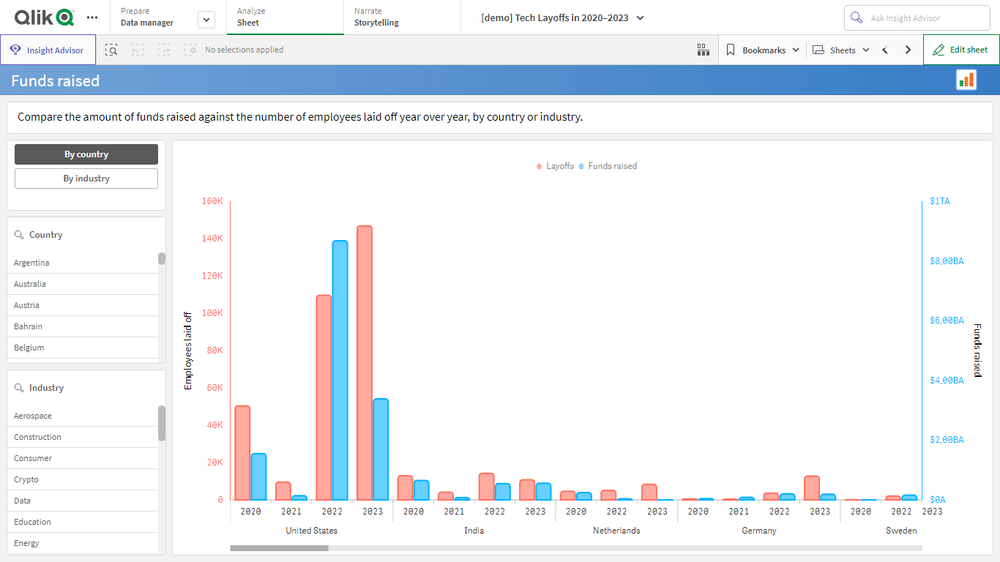
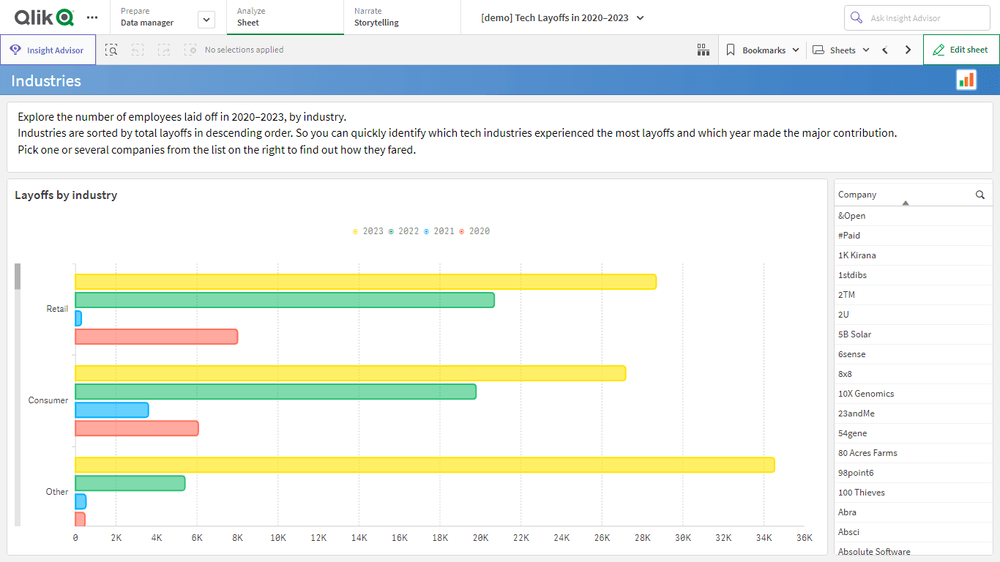
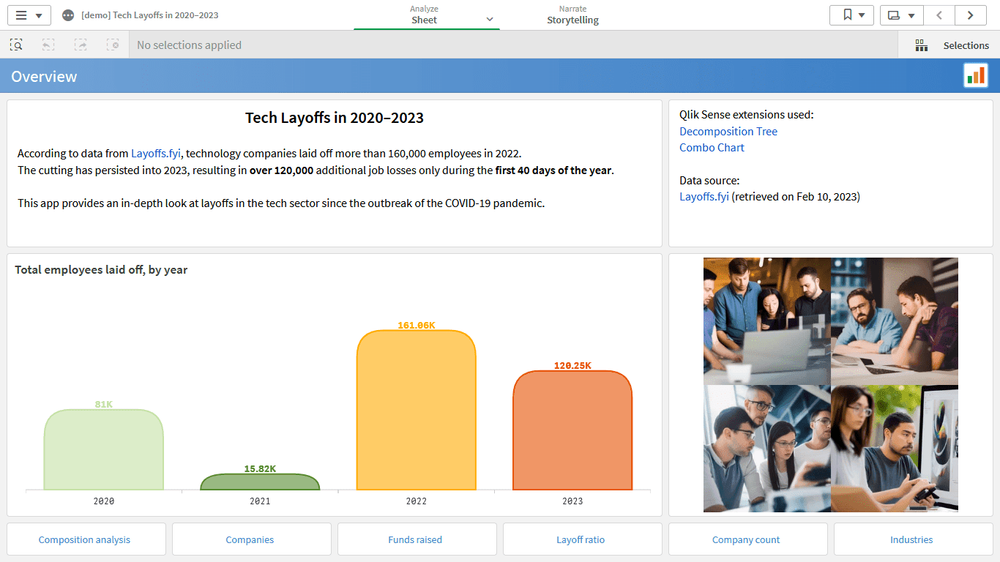
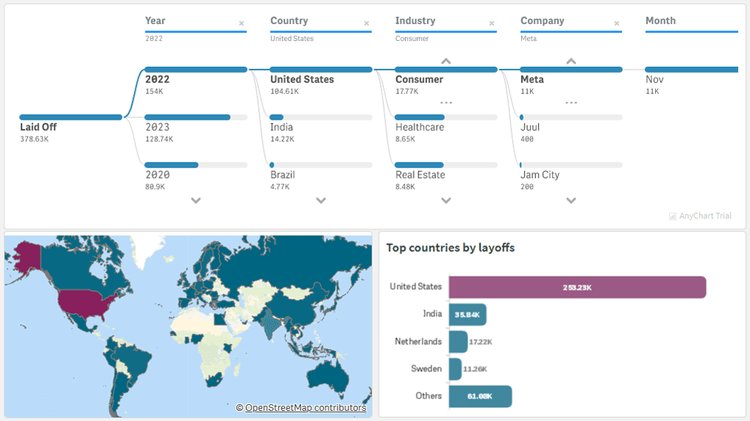
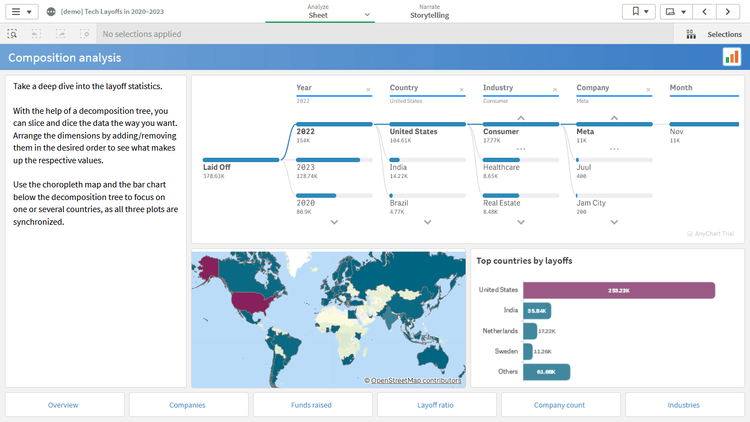
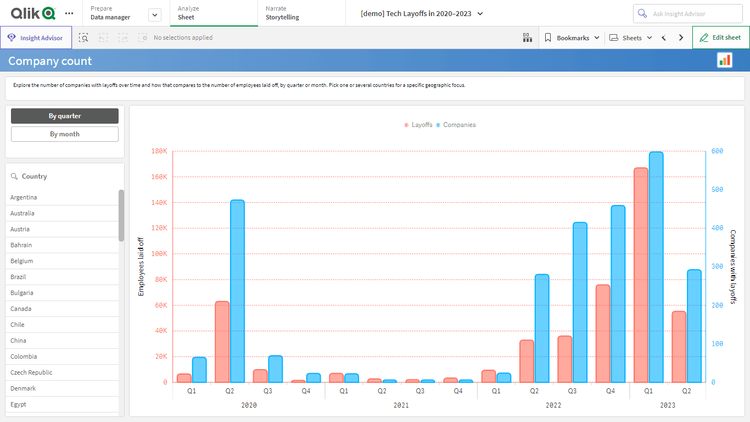
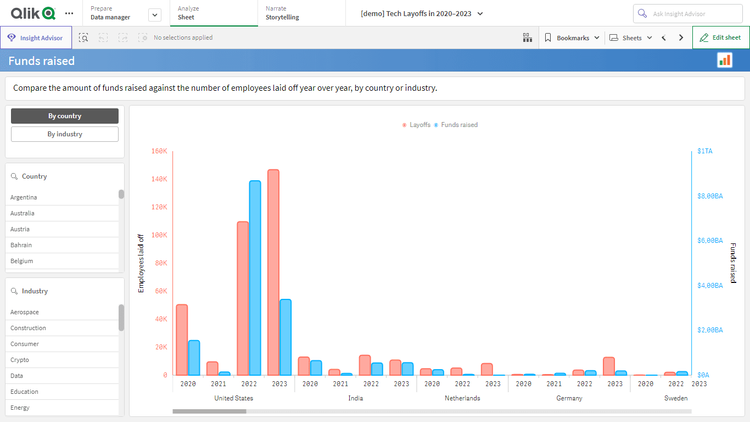
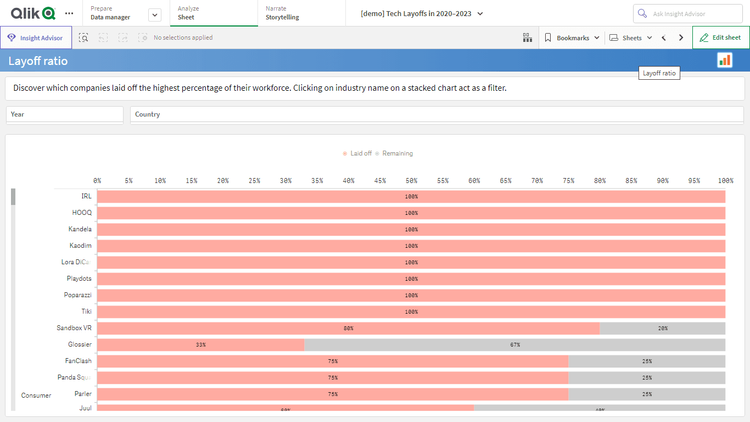
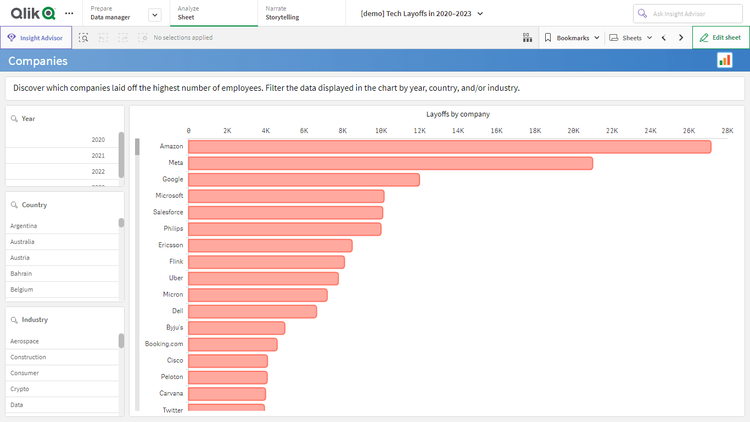
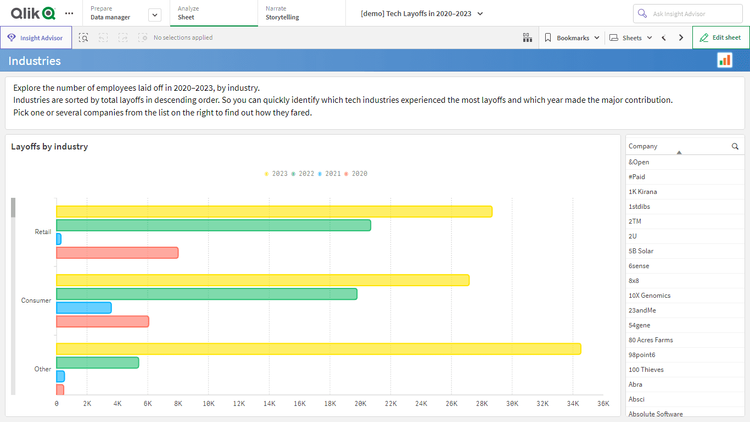
新型コロナのパンデミック以降の世界のテック業界におけるレイオフを、Layoffs.fyi のデータで探索しましょう。Qlik Sense アプリの分解ツリーとコンボチャートのビジュアライゼーションを用いて、どの国・業種・企業で、いつ最も多くの人員削減が発生したかを特定できます。レイオフ数と調達資金を比較し、過去数年のテック業界のレイオフ統計に関するさらなるインサイトを得ましょう。
このアプリケーションには、Qlik Sense 用分解ツリー拡張機能で構築された分解ツリーと、AnyChart 拡張機能で作成したコンボチャートのビジュアライゼーションが搭載されています。分析に使用したデータは Layoffs.fyi に基づき、最終更新日は 2023 年 2 月 10 日です。