
Timeline
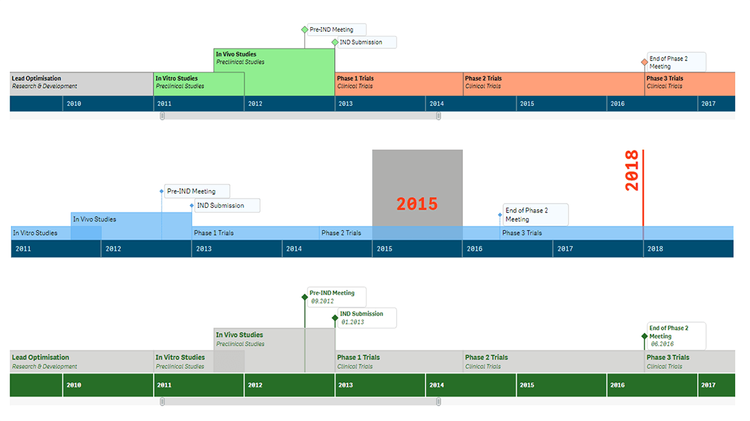
Timeline Chart Features
Timeline charts ensure an illuminating overview of a series of events in chronological order. Explore all major features of our intuitive Timeline Chart Extension for Qlik Sense while looking at a fictional drug development process visualization. See multiple options to customize ranges and moments, set markers and labels, configure axes, navigation, tooltips, and much more demonstrated in action.
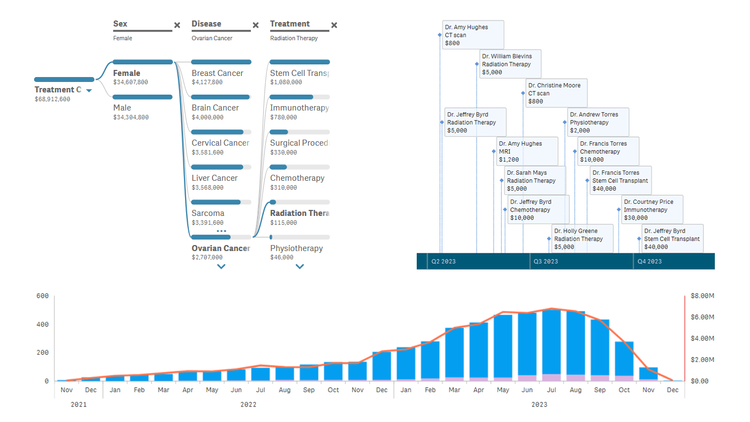
Healthcare Dashboard
Unlock transformative insights in healthcare using Qlik Sense with AnyChart's extensions: Decomposition Tree, Gantt Chart, Combo Chart, Sunburst Chart, and Timeline Chart. Dive deep into metrics like admissions, patient counts, and treatment costs. Perform root cause analysis or ad-hoc explorations with ease. Maintain clear, actionable visibility of doctor-patient timelines and track each patient's journey with insightful precision.
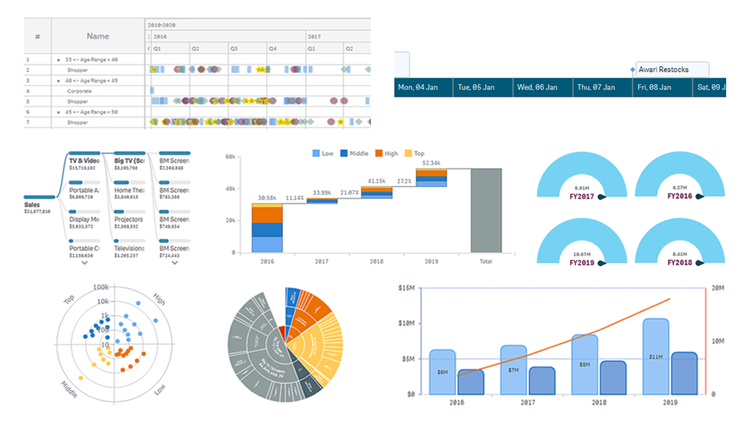
AnyChart Complex Demo
Named best in data analytics and visualization in 2023, AnyChart offers a set of innovative Qlik Sense extensions. Discover the power of the major ones in a quick demo overview and see how they can help you take your visual analytics in Qlik to the next level: Decomposition Tree, Gantt Chart, Combo Chart, Circular Gauge, Bullseye Chart, Sunburst Chart, Timeline Chart, and Waterfall & Advanced Waterfall Chart.