
Combo Chart
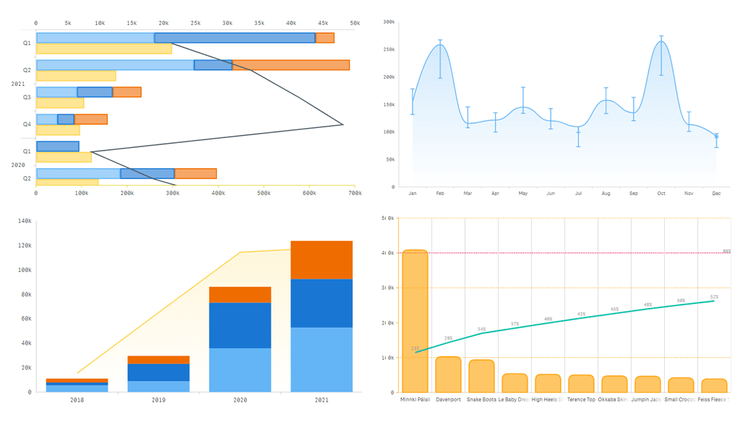
Advanced Combo Chart Features
Meet the unprecedentedly flexible combo charting technique in Qlik Sense designed to help you get even more and deeper insight into your data with the same ease you expect from Qlik! Explore all major features of our intuitive Combo Chart Extension for Qlik Sense by surfing through multiple available chart types and their combinations. See nested axes, error bars, stacking, rich visual settings, and much more demonstrated in action.
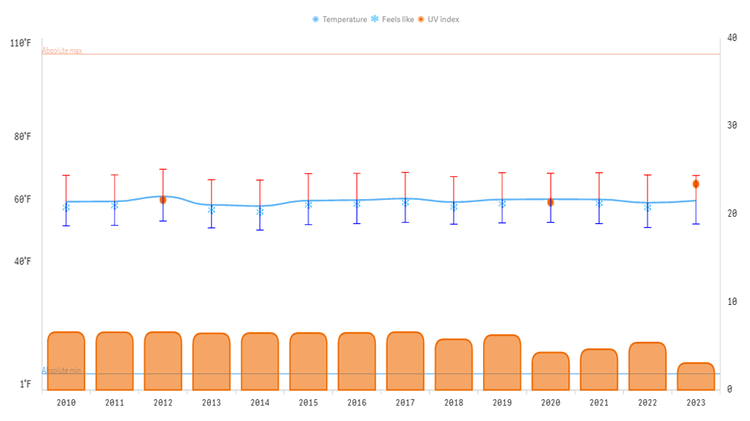
U.S. Climate
Examine climate data for the United States between 2010 and 2023 from various perspectives. Monitor air temperatures and assess the comfort level of the weather. Delve into precipitation, wind, humidity, pressure, UV index, and cloud cover data, compare year-over-year trends, and discover more with multiple flexible combo charts powered by our dedicated extension for Qlik Sense.
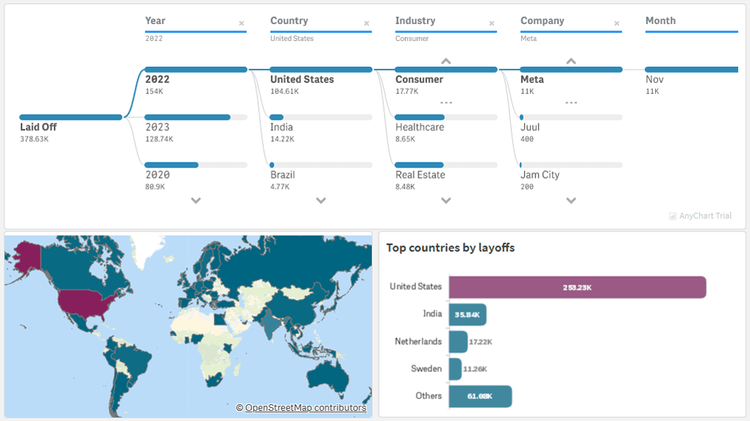
Tech Layoffs
Explore layoffs in the technology sector worldwide since the COVID-19 pandemic with data from Layoffs.fyi. Using the decomposition tree and combo chart visualizations in this Qlik Sense app, identify which countries, industries, and companies have experienced the most job cuts and when they occurred. Compare the number of layoffs with funds raised and gain other insights into tech layoff statistics over the past few years.
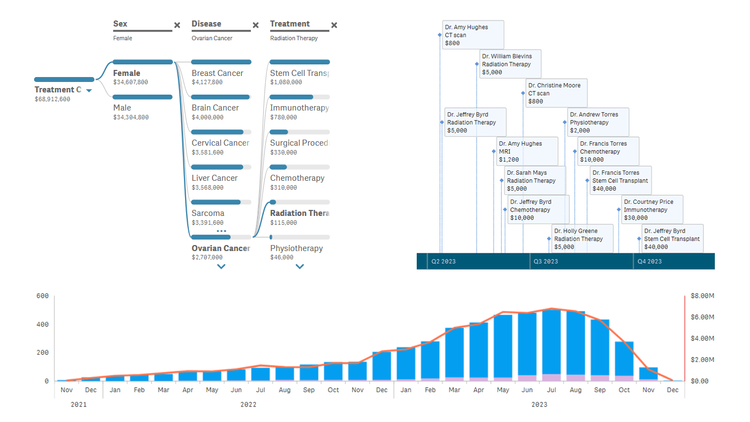
Healthcare Dashboard
Unlock transformative insights in healthcare using Qlik Sense with AnyChart's extensions: Decomposition Tree, Gantt Chart, Combo Chart, Sunburst Chart, and Timeline Chart. Dive deep into metrics like admissions, patient counts, and treatment costs. Perform root cause analysis or ad-hoc explorations with ease. Maintain clear, actionable visibility of doctor-patient timelines and track each patient's journey with insightful precision.
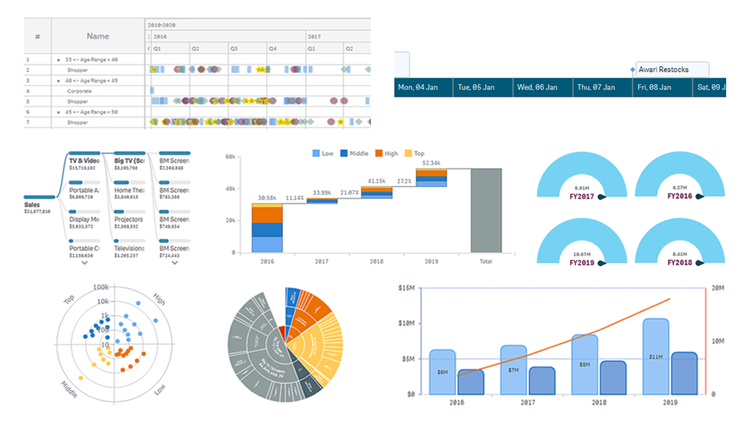
AnyChart Complex Demo
Named best in data analytics and visualization in 2023, AnyChart offers a set of innovative Qlik Sense extensions. Discover the power of the major ones in a quick demo overview and see how they can help you take your visual analytics in Qlik to the next level: Decomposition Tree, Gantt Chart, Combo Chart, Circular Gauge, Bullseye Chart, Sunburst Chart, Timeline Chart, and Waterfall & Advanced Waterfall Chart.