
Circular Dendrogram
Circular Dendrogram Extension for Qlik
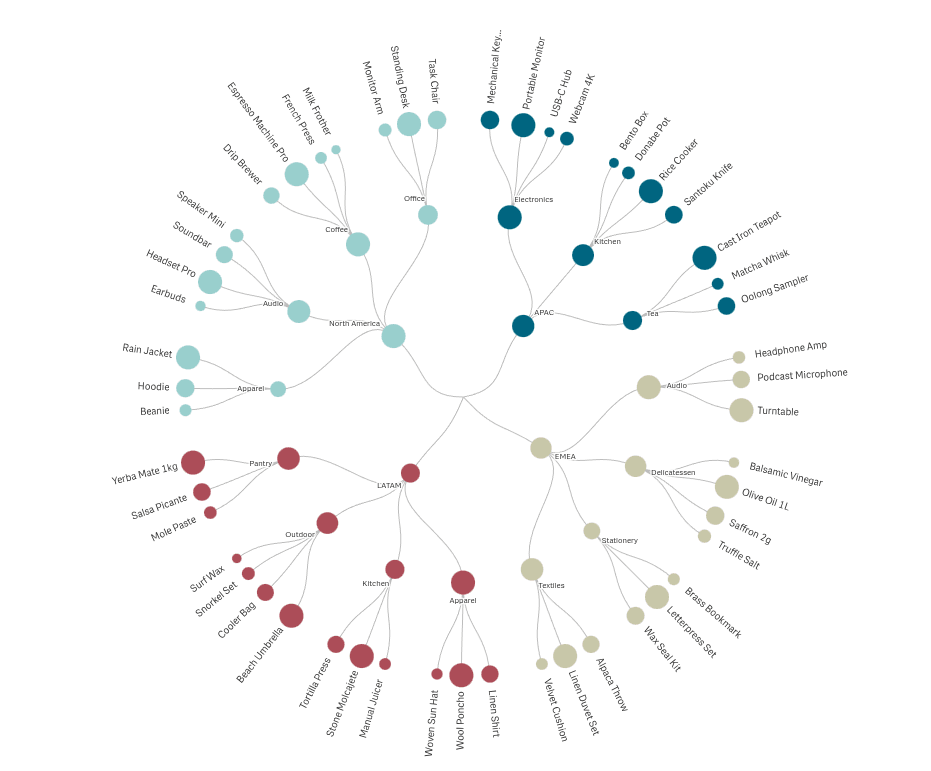
The Circular Dendrogram extension for Qlik visualizes hierarchical relationships as a radial tree. Branches fan out from the center to leaves on the perimeter, with a line drawn for every parent-child relationship. Each top-level branch is rendered in a distinct color from the active Qlik theme, and node sizes carry your measure — so structure and values read together at a glance.
When to Use It
- Organizational charts — Show divisions, departments, services, and staff in one view.
- Product or service taxonomies — Map a category tree from top-level groups down to individual SKUs.
- Biological or scientific classification — Render kingdom → phylum → class → order → family hierarchies.
- File systems and folder hierarchies — Visualize directory structures with file size as the measure.
- Any nested-category data — Two to ten dimension columns combine into a single readable radial tree.
Key Features
- 2 to 10 dimensions describing the hierarchy levels, plus one measure that drives node sizing, label values, and tooltips.
- Three label layouts — upright Horizontal, rotated Radial, or Outside with lines: labels placed beyond the chart, joined by connector lines that never cross. When space is tight, labels are granted by value — every branch's biggest item is always represented.
- Label density and full-label mode — one slider decides how many labels appear in any layout; an optional toggle renders complete label text without shortening. With name-and-value labels, the value always survives truncation.
- Chart shape and fill — full circle or half circle docked to any side of the tile; Stretch to fill uses the whole tile on non-square cells.
- Node sizing you can tune — nodes size against their siblings or their whole level, with a contrast slider from uniform to maximum spread and an optional cap at the parent's size.
- Colors from your theme — or your expression — branch colors follow the active Qlik theme; node and label colors can be driven by your own color expression, and label text can match its node's color.
- Branch backgrounds — optional color-matched tints behind each branch, extendable behind the outer labels.
- Center hub and images — an optional center circle with its own label, a logo clipped inside the hub, or a faint background image behind the whole chart.
- Top-N grouping — collapse small branches into a synthetic Others node, at the last dimension only or across all dimensions.
- Standard Qlik integration — selections, snapshots, story replay, calculation conditions, and data export.
Why Circular Dendrogram?
- Structure first — unlike a treemap (which packs by value) or a sunburst (which shows totals by ring), a dendrogram draws every parent-child relationship as an explicit line. The shape of the hierarchy is the visual.
- Labels that stay readable — three layouts, density control, and value-ranked label selection keep even crowded charts legible.
- Selection that tells a story — clicking highlights the full path in the theme's selection color, connector lines included; same-value matches elsewhere render dashed; everything unrelated dims. Narrow to a single path and the chart re-renders as a clean centered line.
- Native Qlik experience — theme palettes, calculation conditions, snapshots, and stories work out of the box, and the property panel speaks plain Qlik language with helper notes on the complex controls.
For full configuration details, see the Circular Dendrogram documentation.
Other extensions by AnyChart