
Project Gantt Chart Features
Gantt charts are an essential project management tool. Explore all major features of the Project Gantt Chart in Qlik Sense in this Qlik demo application.Project Gantt Chart Features


About this app
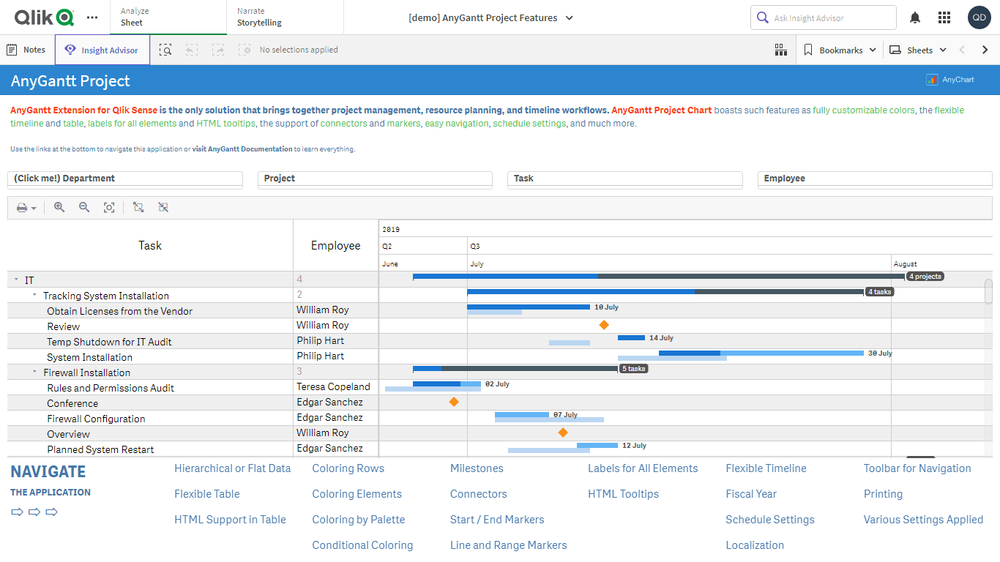
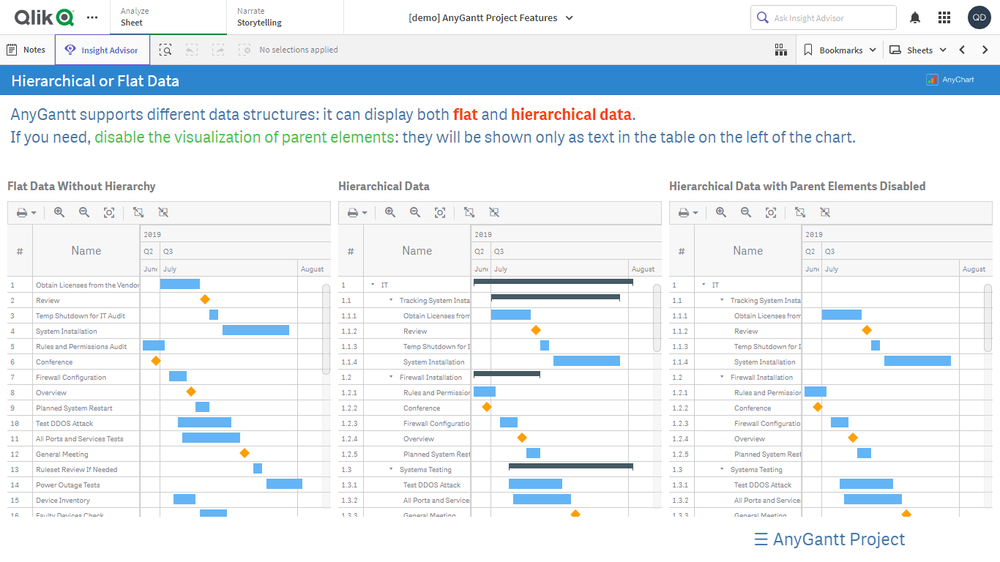
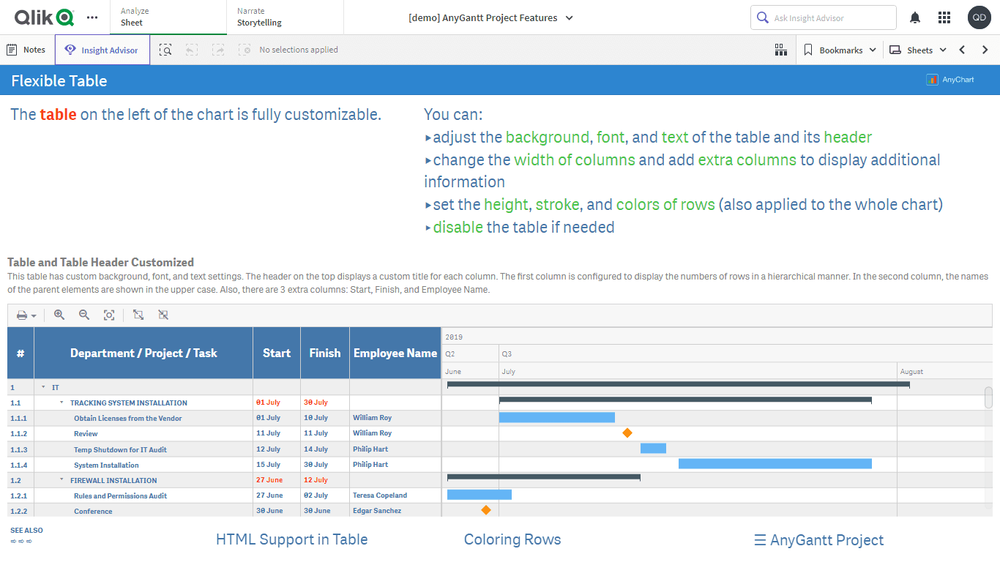
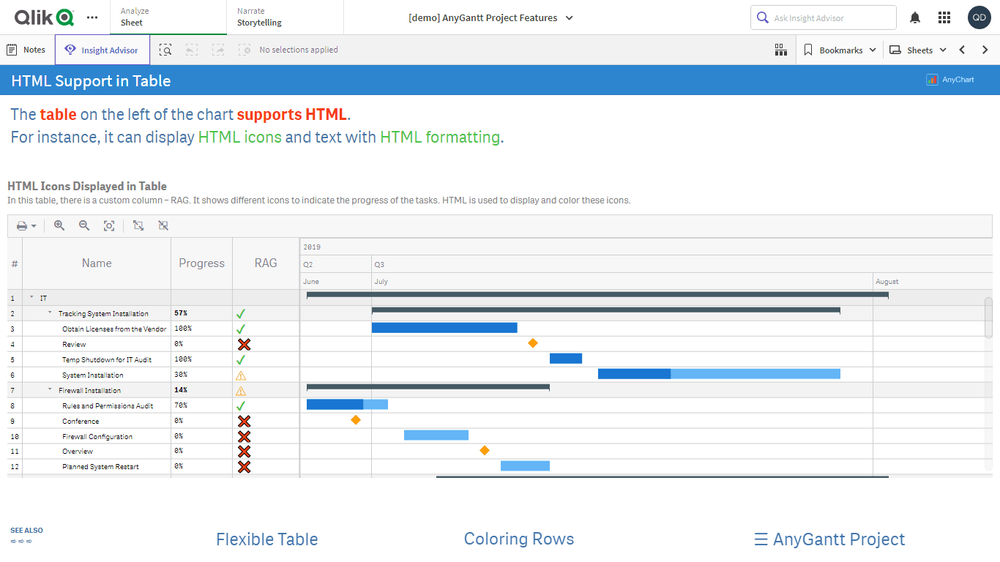
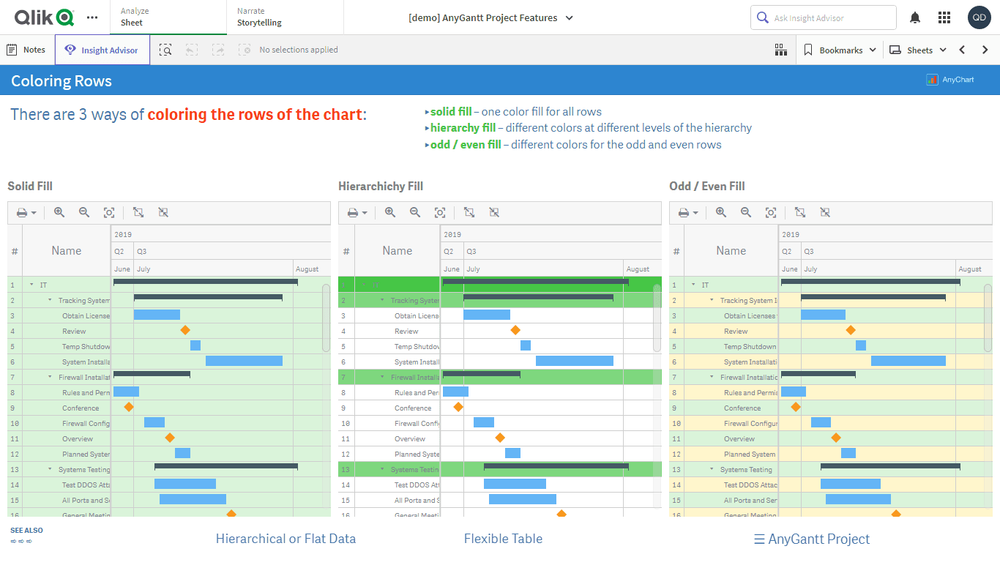
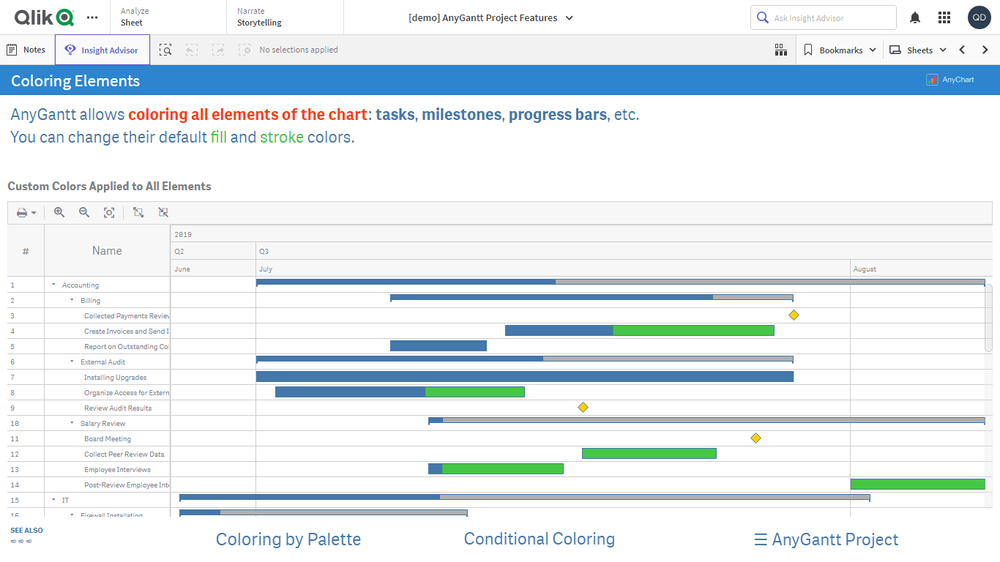
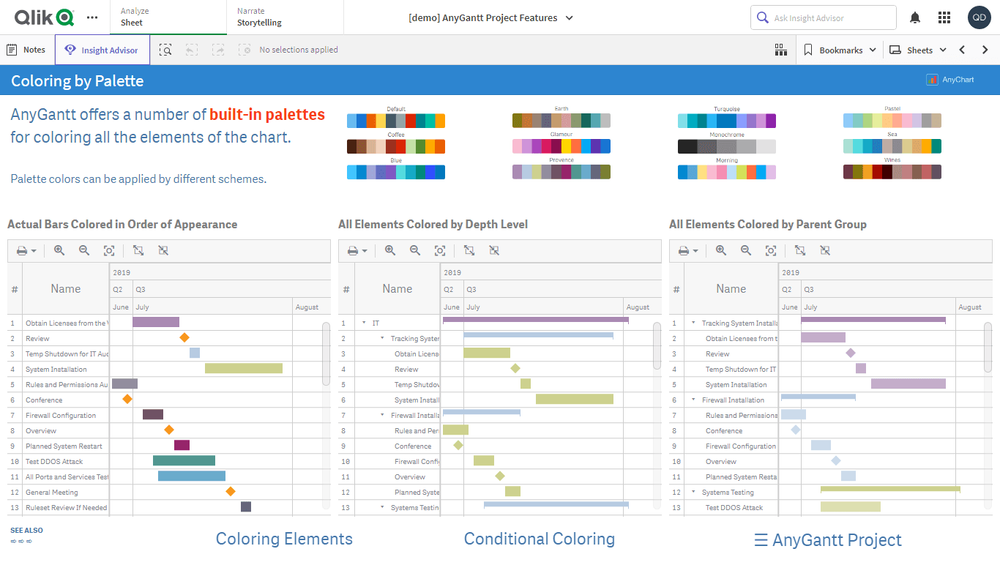
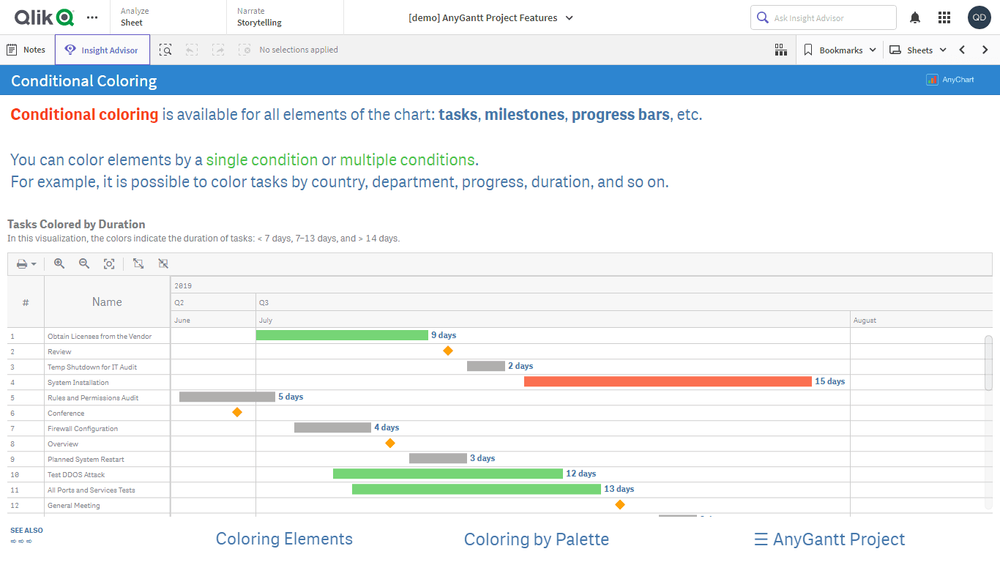
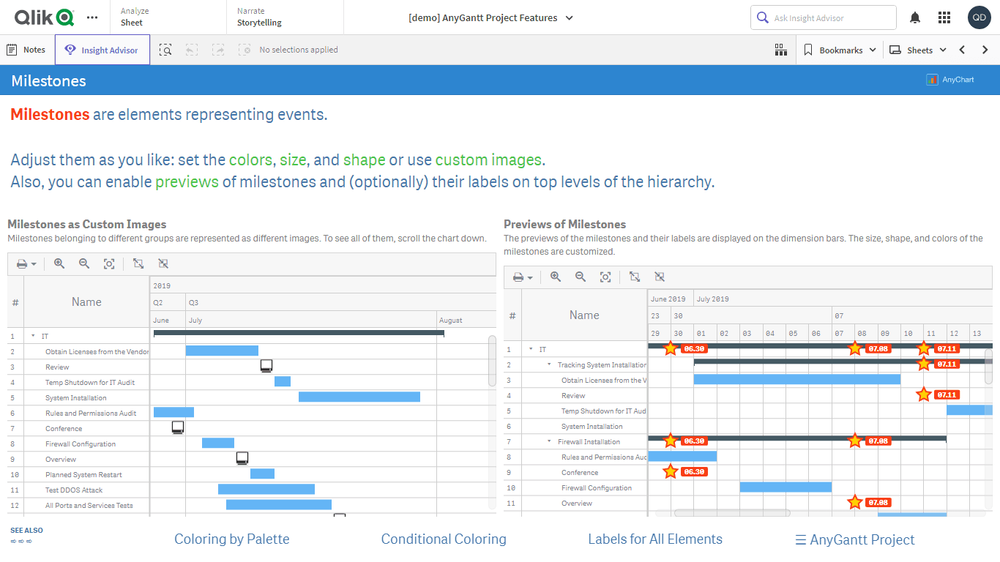
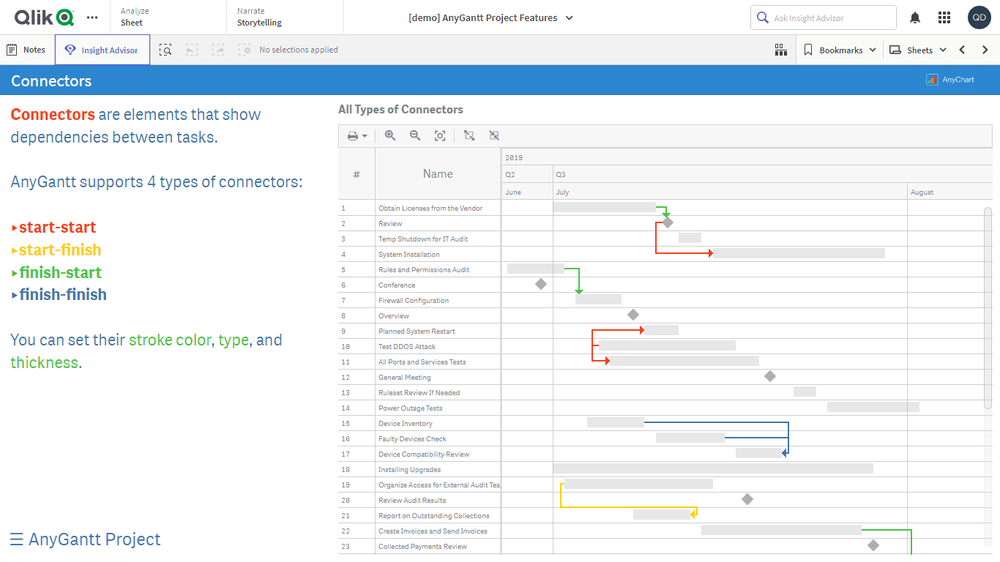
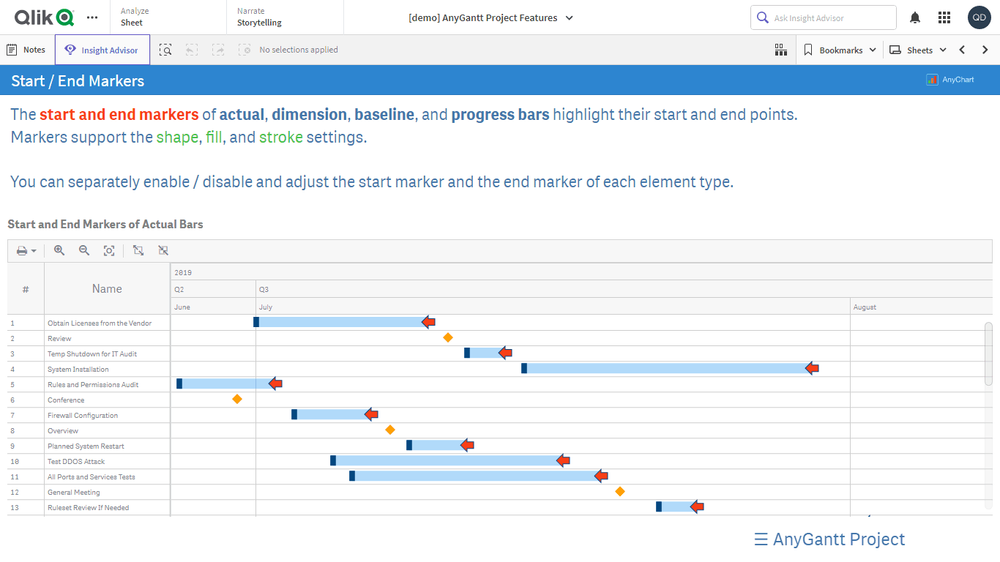
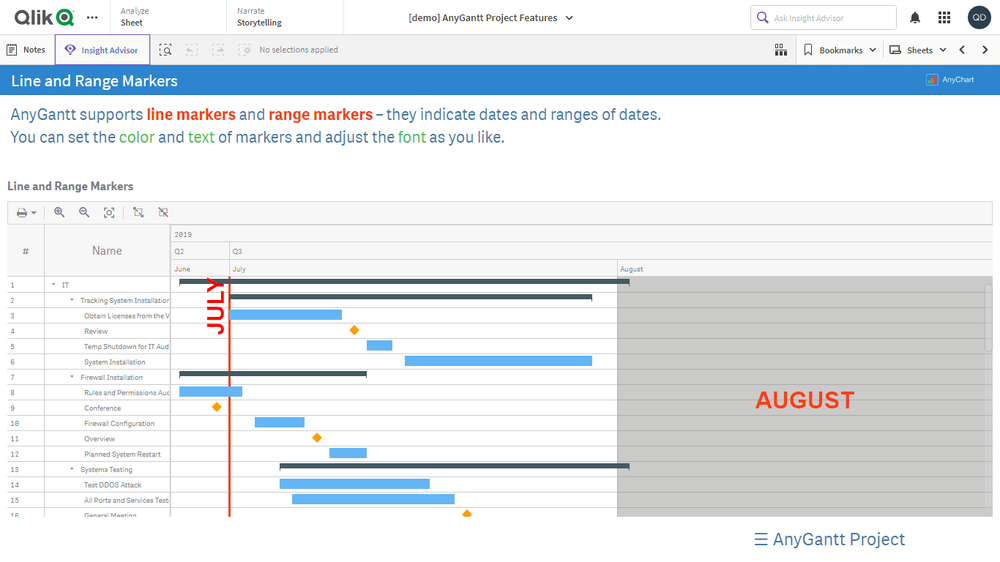
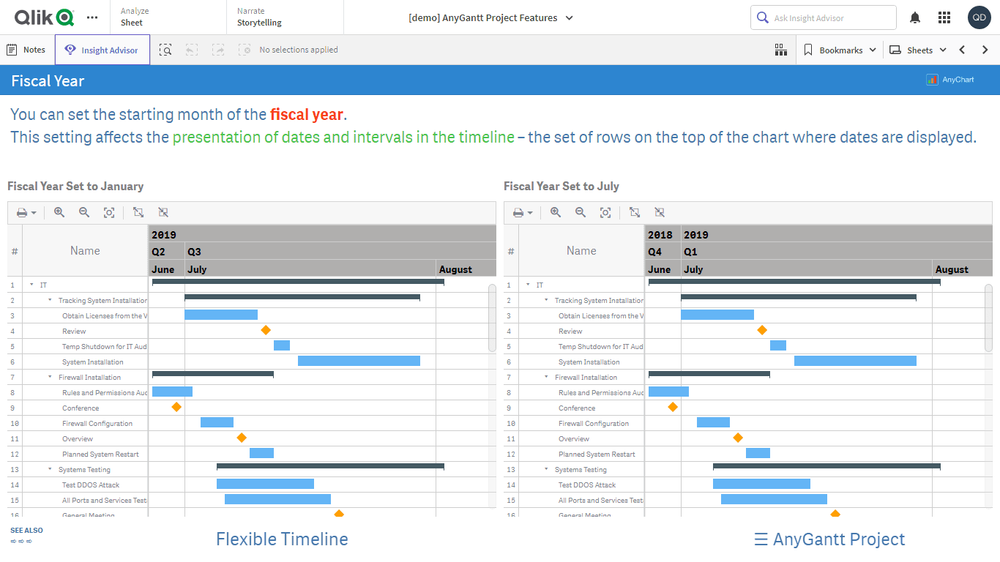
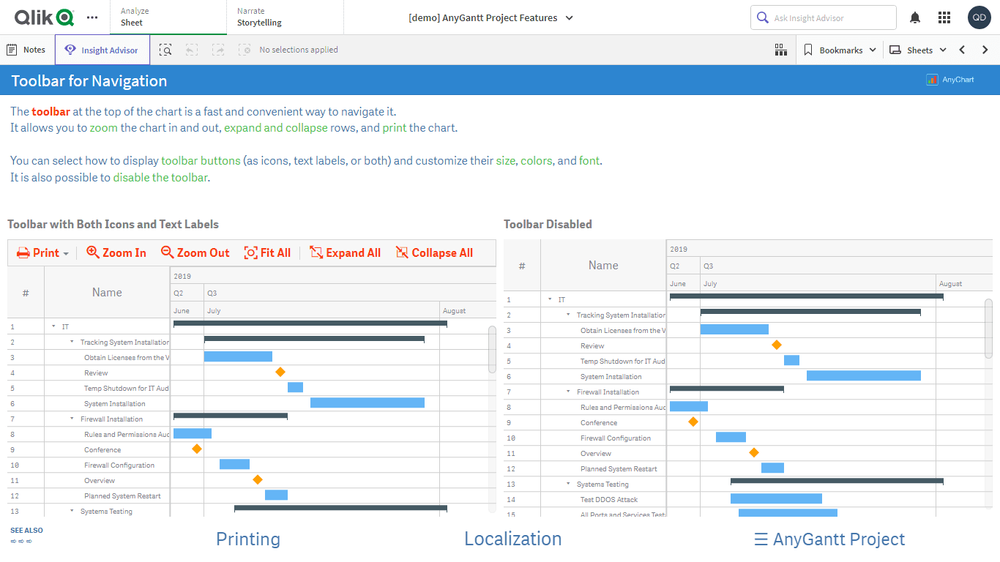
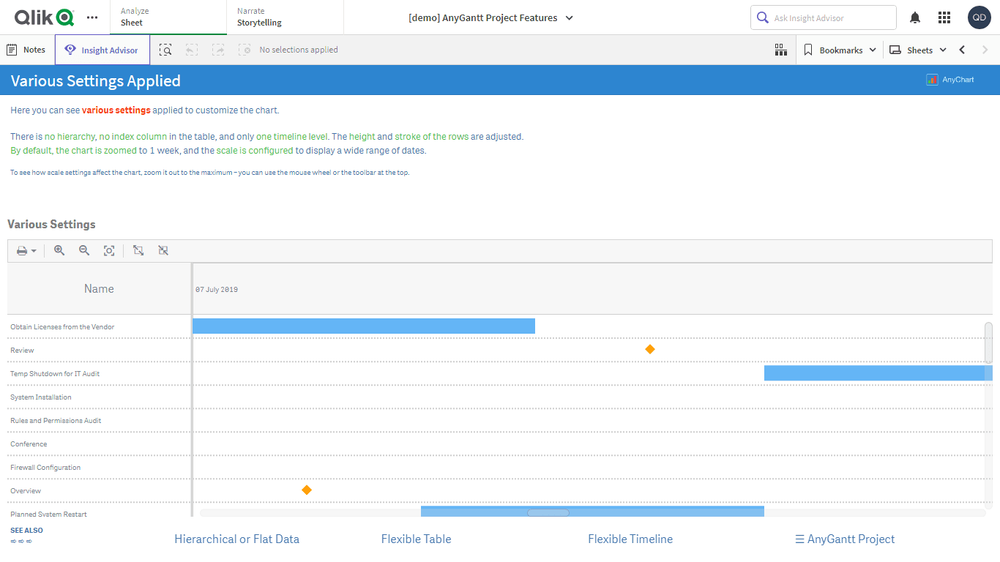
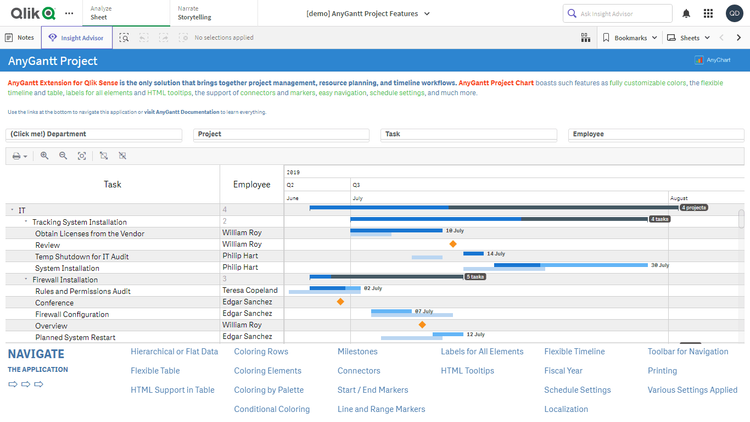
Gantt charts are an essential project management tool, ideal for showing a project schedule. Explore all major features of our intuitive Project Gantt Chart Extension for Qlik Sense while looking at this visualization of (fictional) project data. See different data structures, customizable tables and timelines, flexible milestones, dependency connectors, fiscal year settings, coloring patterns, and much more demonstrated in action.
This application features a Project Gantt Chart built with the AnyGantt extension for Qlik Sense. The dataset is fictional.