AnyChart Extension for Qlik: Sunburst Chart
Basics
Downloading and Installing
Qlik Sense Desktop
To install AnyChart Sunburst Extension in Qlik Sense Desktop, do the following:
- Download AnyChart Sunburst Extension for Qlik Sense.
- Extract the archive.
- Open a Windows Explorer window and navigate to the Qlik Sense Extensions directory:
..\Users\<UserName>\Documents\Qlik\Sense\Extensions. - Copy the anygantt-4x-sunburst folder to the Extensions directory.
- Relaunch Qlik Sense Desktop.
Qlik Sense Server
To install AnyChart Sunburst Extension on a Qlik Sense server,
- Download AnyChart Sunburst Extension for Qlik Sense.
- Open Qlik Management Console (QMC): https://<QPS server name>/qmc
- Select Extensions on the QMC start page or from the Start drop-down menu.
- Click Import in the action bar.
- In the dialog, select the downloaded archive. Leave the password area blank.
- Click Open in the file explorer window.
- Click Import.
Qlik Sense Cloud
To install AnyChart Sunburst Extension in Qlik Sense Cloud, do the following:
- Download AnyChart Sunburst Extension for Qlik Sense Cloud.
- Access the Management Console:
- add /console to your tenant address: https://<your tenant address>/console
- or use the navigation link Administration under the user profile in the hub
- Go to the Extensions page and click Add.
- In the dialog, select the downloaded archive.
- Click Add.
- In the Management Console, go to the Content Security Policy section and click Add.
- In the dialog, give the Content Security Policy a name – for example, AnyChart.
- Type the address of the origin server: qlik.anychart.com
- Select the following directives:
- connect-src
- font-src
- img-src
- script-src
- style-src
- Click Add.
Overview
The Sunburst chart, otherwise known as a radial treemap or multilevel pie chart, is a visualization that displays hierarchically organized data as a set of nested rings divided into slices. The sizes of slices represent their values.
Read Quick Start and Dimensions and Measures to learn how to add a Sunburst chart and what dimensions and measures to use.
You can configure the appearance of the chart: set the colors and inner radius, add center content ,and adjust the labels and tooltips.
Also, the following options are available: interactivity, calculation conditions.
Quick Start
This quick tutorial explains how to create a basic Sunburst chart.
First of all, add an empty chart to your sheet:
- Go to Custom objects > AnyChart in the assets panel.
- Drag an empty AnyChart Sunburst chart to the sheet.
Then add two dimensions:
- Go to Dimensions in the properties panel.
- Click Add dimension and select a dimension.
- Click Add dimension and select a dimension.
Finally, add a measure, which is used to calculate the sizes of slices:
- Go to Measures in the properties panel.
- Click Add measure and select a measure.
Please note that you can also create dimensions and measures from fields or add them by clicking on buttons on the empty chart.
Dimensions and Measures
Dimensions
To add a dimension, do the following:
- Go to Dimensions in the properties panel.
- Click Add dimension and select a dimension.
The Sunburst chart requires only one dimension. However, with one dimension it looks like an ordinary (one-level) pie chart. To create a multilevel chart, add two or more dimensions.
Please keep in mind that you need to arrange dimensions in the correct order, from higher levels to lower ones: just drag them in the properties panel.
AnyChart Sunburst can display hierarchical data with one root or several roots:

Each slice of the chart has a text label, which displays its dimension and measure. But labels can display a different text if needed. For example, you can use numeric identifiers of categories as a dimension and at the same time display names of categories as labels. See the Labels section to learn more.
Measures
To add a measure, do the following:
- Go to Measures in the properties panel.
- Click Add measure and select a measure.
The measure is used to calculate the sizes of slices. In your visualizations, you can use any measures with any aggregations as well as set measures as custom expressions. For example, you can use a custom expression to hide slices that are too small.
Appearance
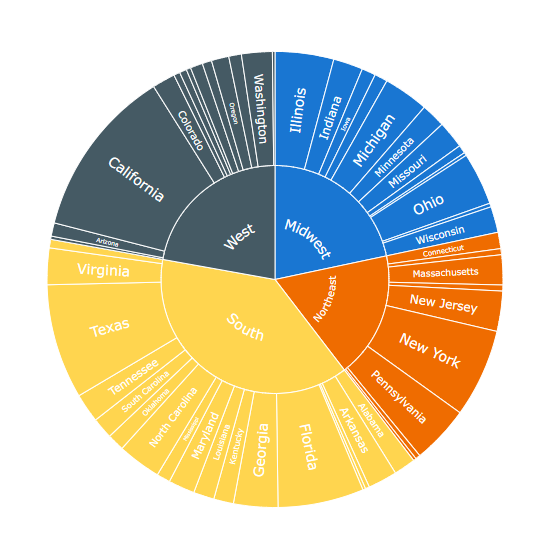
Color by Expression
The slices of the chart are colored by the default palette. Alternatively, you can color them by expression.
Coloring by expression sets colors using a user-defined expression. When coloring by expression, you can define both what colors to use and which values to use them with, enabling more control over how colors are used in the visualization. For example, you might highlight values of particular interest, or differentiate between values within different value ranges. Coloring by expression can also be used to color a visualization by values not included within a visualization.
To color slices by expression, do the following:
- Go to Appearance > Colors in the properties panel.
- Switch the Colors slider.
- Select By expression from the first drop-down menu.
- Enter an expression in the input box.
Examples
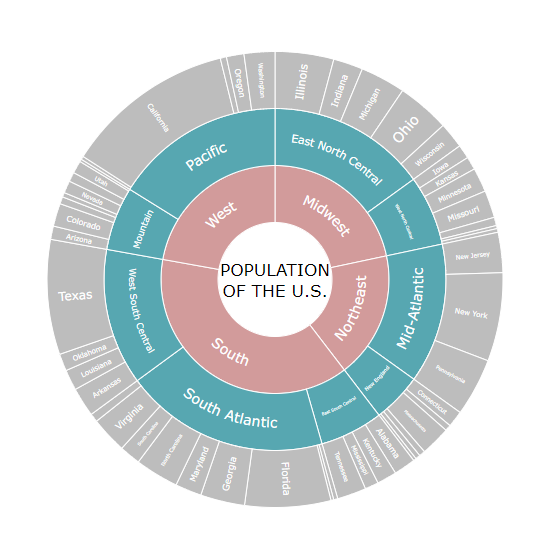
Example: Coloring by parent
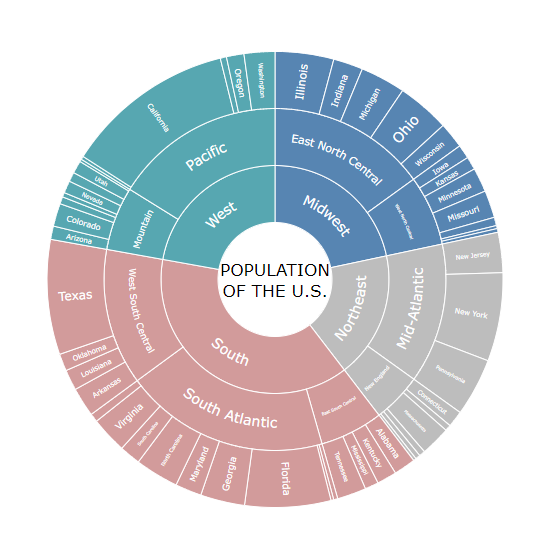
Pick(Match(RegionName,
'South', 'West', 'Midwest', 'Northeast'),
'#d29b9b', '#57a7b1', '#5785b2', '#bdbdbd')
In this example, 4 colors distinguish slices belonging to 4 different parent groups.
Example: Coloring by hierarchy level
If(Dimensionality() = 1, '#d29b9b',
If(Dimensionality() = 2, '#57a7b1',
If(Dimensionality() = 3, '#bdbdbd')))
In this example, 3 colors distinguish slices belonging to 3 different hierarchy levels.
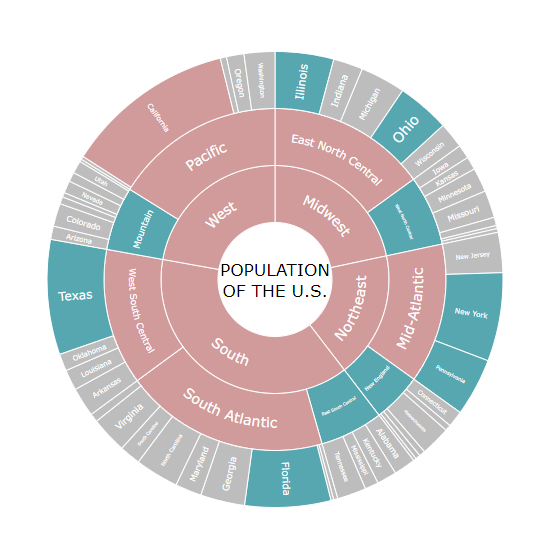
Example: Coloring by measure
If(Sum(CENSUS2010POP) >= 30000000, '#d29b9b',
If(Sum(CENSUS2010POP) >= 10000000, '#57a7b1',
'#bdbdbd'))
Here 3 colors indicate 3 population sizes: >= 30M, >= 10M and < 30M, and the rest ( < 10M).
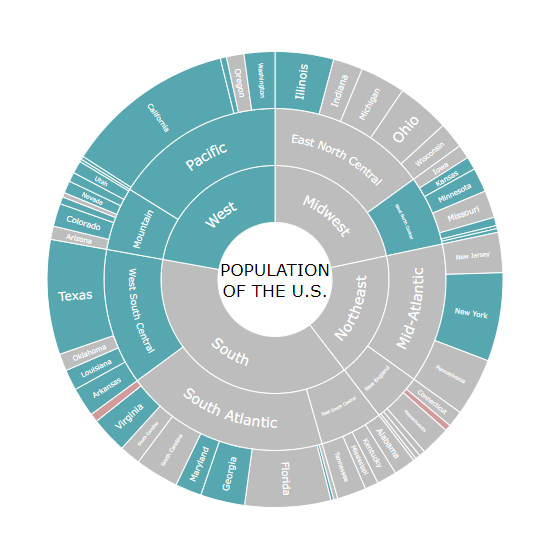
Example: Coloring by alternative measure
If(Avg(RNATURALINC2011) <= 0, '#d29b9b',
If(Avg(RNATURALINC2011) < Avg(TOTAL{1<Country = {'U.S.'}>}RNATURALINC2011), '#bdbdbd',
If(Avg(RNATURALINC2011) >= Avg(TOTAL{1<Country = {'U.S.'}>}RNATURALINC2011), '#57a7b1')))
Here 3 colors indicate 3 types of the rate of natural increase: <= 0 (red), > 0 but below the total average (gray), and above or equal to the total average (green). The sizes of slices represent another measure – the population size.
Inner Radius
You can adjust the inner radius of the chart to set the size of the open space in the center.
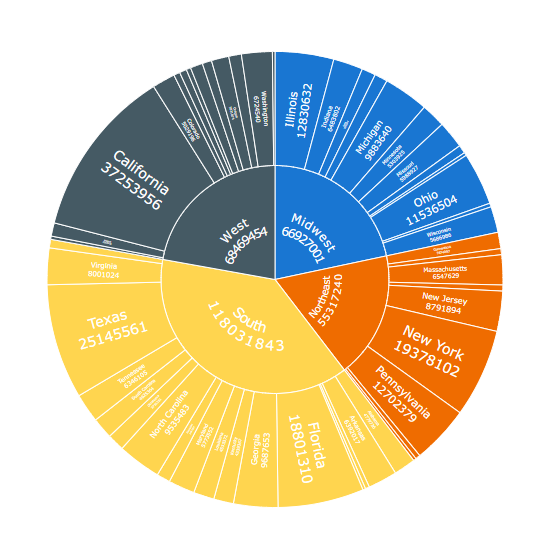
By default, the inner radius is 0%: the center is occupied by the parent element(s), and no extra space is left:
To set the inner radius, do the following:
- Go to Appearance > Presentation in the properties panel.
- Use the Inner radius option.

You can use the space in the center to display center content.
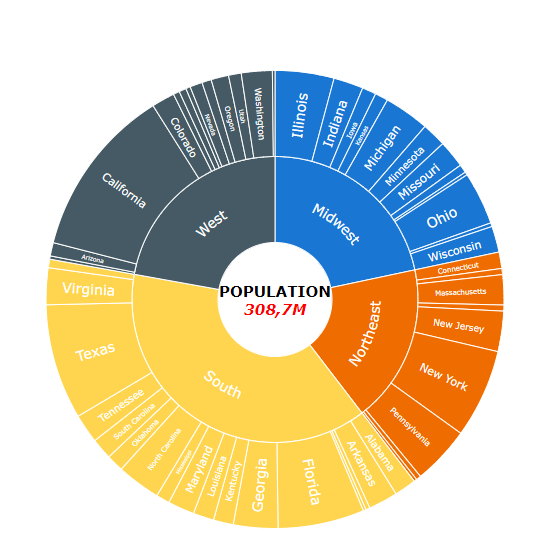
Center Content
When the inner radius is more than 0, there is an open space in the center of the chart. You can use it to display additional information:
- Go to Appearance > Presentation in the properties panel.
- Enter an expression in the Center content input box.
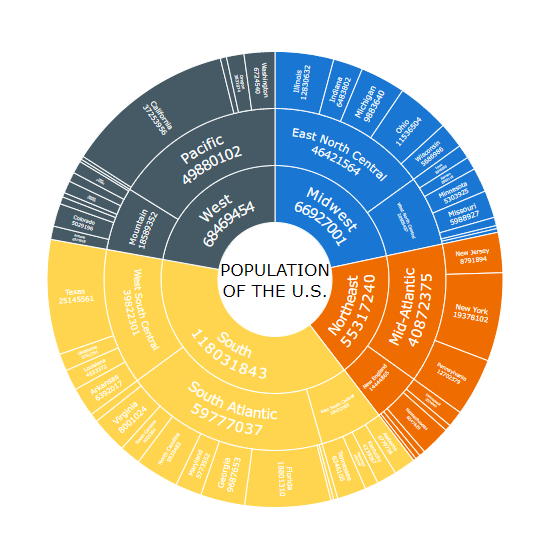
Please note that it is possible to set the center content either as a string value or as an arbitrary string expression. Also, you can use HTML, like in the sample below:
'<b>POPULATION<br><span style=color:red><i>' &
Round(Sum(CENSUS2010POP) / 1000000, 0.1) & 'M</i></span></b>
Labels
Labels are text objects displaying the information about the slices of the chart.
By default, each label displays the dimension and measure of a slice, but you can customize the text:
- Go to Appearance > Label in the properties panel.
- Select a label format from the Text drop-down menu.
- If you select the Expression format, enter an expression in the input box.
The following label formats are available:
| Label Format | Description |
|---|---|
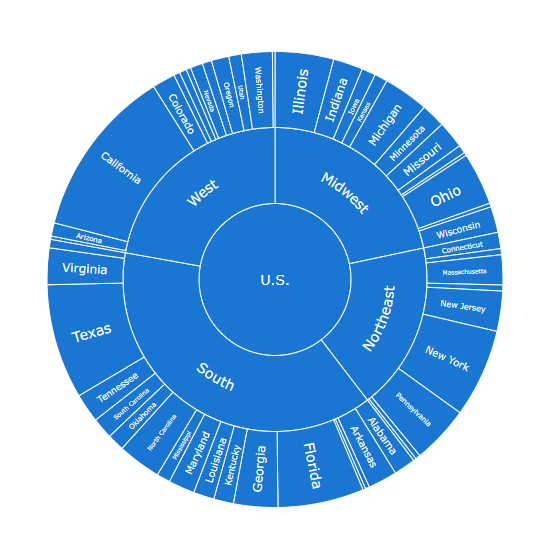
| Dimension | Each label displays the dimension corresponding to the slice. |
| Dimension and measure | Each label displays the dimension and measure corresponding to the slice. |
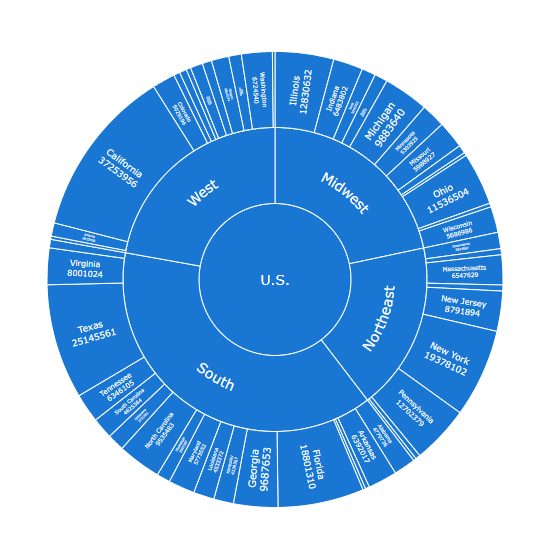
| Measure only outside | The labels of the outside ring, representing the last (lowest) level of the hierarchy, display dimensions and measures. The labels of all the inside rings display only dimensions. |
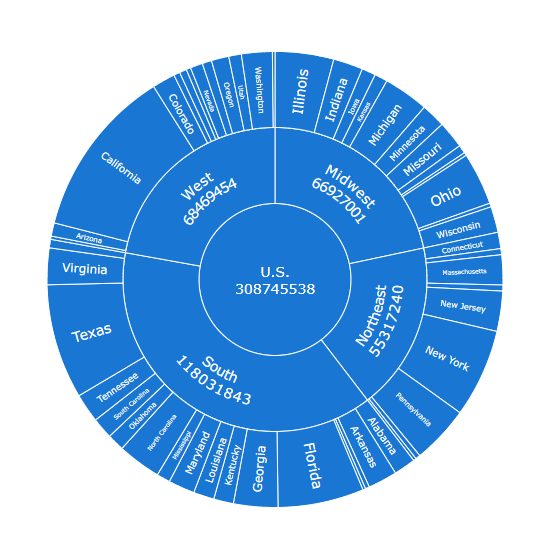
| Measure only inside | The labels of all the inside rings display dimensions and measures. The labels of the outside ring, representing the last (lowest) level of the hierarchy, display only dimensions. |
| Expression | Labels display a custom (user-defined) text. |
Dimension
Dimension and Measure

Measure only Outside
Measure only Inside
Please note that if you select the Expression option, it is possible to set the label text either as a string value or as an arbitrary string expression. Using expressions allows you to highlight values of particular interest, display values not included within a visualization or results of calculations, and so on.
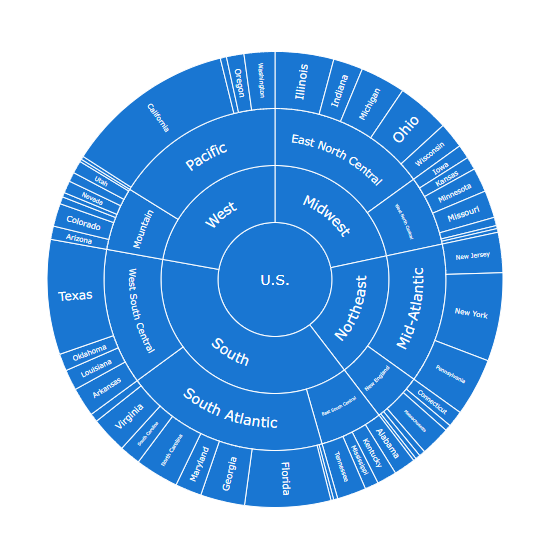
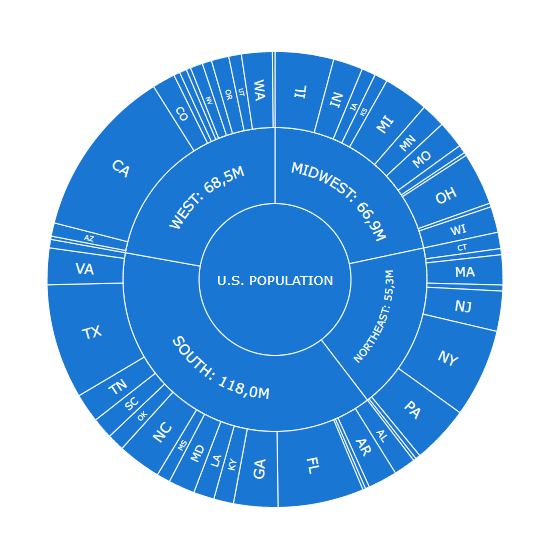
In the example below, slices at different levels of the hierarchy display different labels:
If(Dimensionality() = 1, Country & ' POPULATION',

If(Dimensionality() = 2,
Upper(RegionName) & ': ' & Round(Sum(CENSUS2010POP) / 1000000, 0.1) & 'M',

If(Dimensionality() = 3, StateCodes)))
Tooltips
Tooltips are text boxes that appear when the user hovers over the slices of the chart. You can set a custom tooltip text.
Please note that it is possible to set the tooltip text either as a string value or as an arbitrary string expression. Using expressions allows you to highlight values of particular interest, display values not included within a visualization or results of calculations, and so on.
Also, you can use HTML in tooltips.
To disable or enable tooltips, go to Interactivity in the properties panel and switch the Tooltips slider.
To configure the tooltip text,
- Go to Appearance > Tooltip in the properties panel.
- Switch the Tooltip text slider.
- Enter a string value or a string expression in the input box.
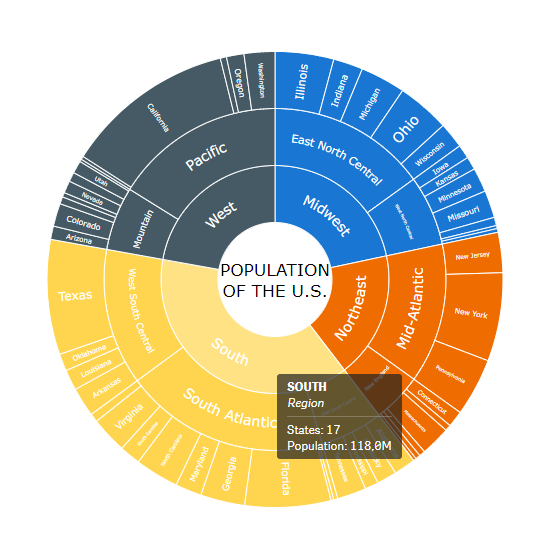
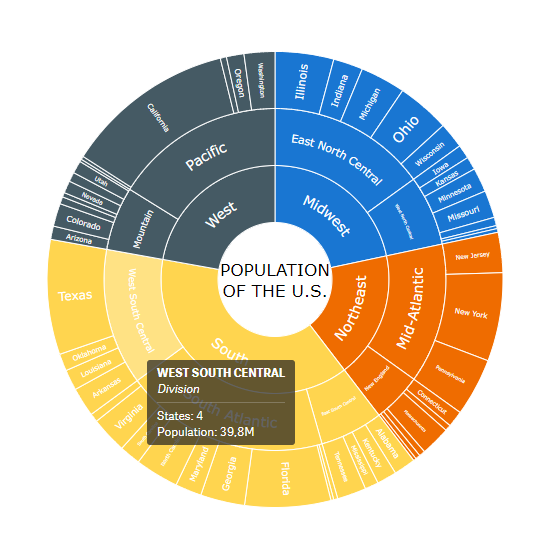
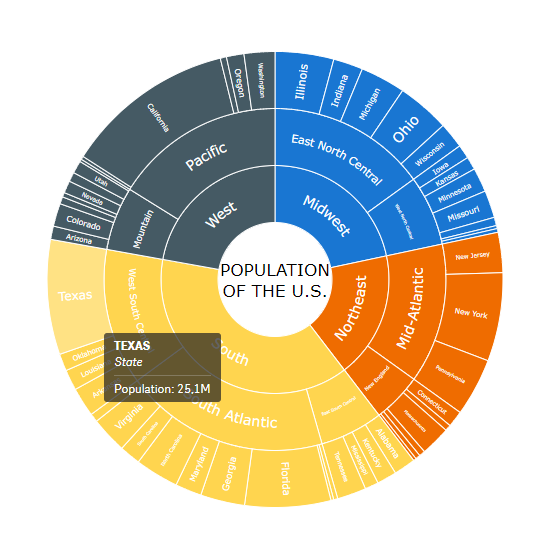
Tooltips of different slices can display different texts. For example, the text can vary depending on the hierarchy level:
If(Dimensionality() = 1,
'<b>' & Upper(RegionName) & '</b><br><i>Region</i>' &
'<hr>States: ' & Count(State) & '<br>',

If(Dimensionality() = 2,
'<b>' & Upper(DivisionName) & '</b><br><i>Division</i>' &
'<hr>States: ' & Count(State) & '<br>',

If(Dimensionality() = 3,
'<b>' & Upper(State) & '</b><br><i>State</i><hr>'))) &

'Population: ' & Round(Sum(CENSUS2010POP) / 1000000, 0.1) & 'M'
Other Features
Interactivity
By default, the following interactivity features are available: selection, snapshots, and tooltips. Also, you can set the selection mode or enable drilldown instead of selection.
To disable or enable these features, go to Interactivity in the properties panel and use the following features:
- Selection and Dimension
- Enable drilldown
- Snapshots
- Tooltips
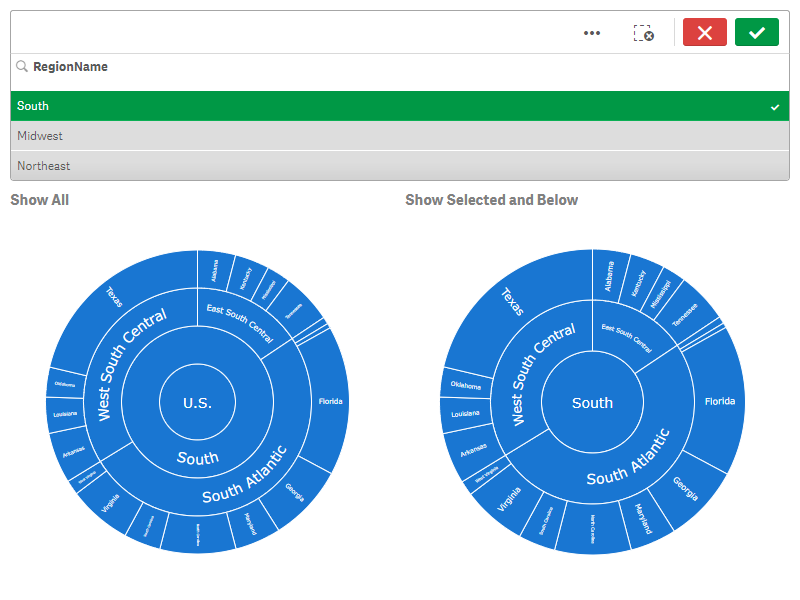
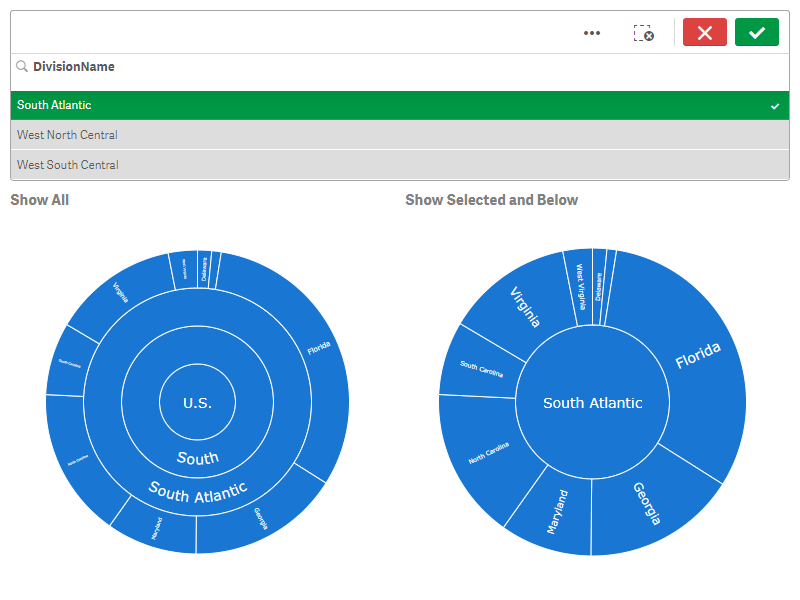
When Selection is enabled, you can set the selection mode by using the Dimension drop-down menu. The following options are available:
| Selection Mode | Description |
|---|---|
| Show all | The chart shows the selected dimension with its parents and children at all the levels above and below. |
| Show selected and below | The chart shows the selected dimension with its children at all the levels below. |
The Enable drilldown option is available only when Selection is disabled. Here is how it works: if you click an element that has children, you drill down to it and its children, and if you click on the parent element, you drill up a level.
Calculation Conditions
AnyChart supports calculation conditions: you can set a condition that needs to be fulfilled (true) for the object to be displayed. If the condition is not fulfilled, a custom message is displayed.
A calculation condition is useful when a chart or table is very big and makes the visualization slow to respond. A calculation condition can then help so that for example an object does not show until the user has filtered the data to a more manageable level by applying selections.
To add a condition, do the following:
- Go to Add-ons > Data handling in the properties panel.
- Enter an expression in the Calculation condition input box.
- Enter a string value or a string expression in the Displayed message input box.
For example, the following expression allows showing the chart only when the user selects less than 20 states:
If(Count(State) < 20, 1, 0)If there are too many states, AnyChart displays this message:
'There are too many states (' & Count(State) & ').'
Kontaktieren Sie unsere Vertriebsmitarbeiter
Unsere Vertriebsmitarbeiter beantworten gerne Ihre Fragen zu unseren Produkten, zur Lizenz, zum Kauf und zu sonstigen Themen.- +1 (888) 845-1211 (USA)
- +44 20 7193 9444 (Europa)
- sales@anychart.com