Version 4.x History
AnyGantt Qlik Extensions version 4.9.0
Released May 30, 2025AnyGantt Qlik Extensions version 4.8.0
Released Sep 11, 2023Customizable Data Loading
Introducing an advanced level of data loading control within Gantt charts, applicable to both Project and Resource visualizations. You can now adjust the row retrieval behavior by defining the data chunk size, achieving an optimal balance between loading speed and seamless scrolling tailored to a specific scenario and your individual preferences.
The default chunk size fetches 50 rows per request, ensuring a harmonious performance. Customize this setting in Add-Ons > Data Handling > Data Chunk, allowing you to select any value between 1 (incremental row-by-row loading) and 10000 (comprehensive initial rendering).
AnyGantt Qlik Extensions version 4.7.257
Released Apr 18, 2023Gantt: Smart Data Loading
Revamped data handling so that data now loads partially and only when it's needed. This results in faster load times and a more responsive user interface. We've also added a "Loading data" message so you know what's going on while you wait.Gantt: Faster Chart Rendering
We've overhauled the rendering mechanism to ensure that chart rendering speed is no longer affected by a large volume of data. You'll notice a dramatic increase in drawing speed!Gantt: Optimized Expression Performance
We've resolved an issue related to expressions that previously caused unnecessary redraws, which used to slow everything down. With this improvement, expressions are optimized for better performance, and you can manipulate data faster and more efficiently.Gantt: Enhanced Printing Capabilities
We've fixed a bug that caused missing labels on Gantt charts when printing through the toolbar. So now you can print your Gantt charts accurately without any issues.Bug fixes:
- Minor bug fixes and improvements
AnyGantt Qlik Extensions version 4.6.256
Released Jan 20, 2023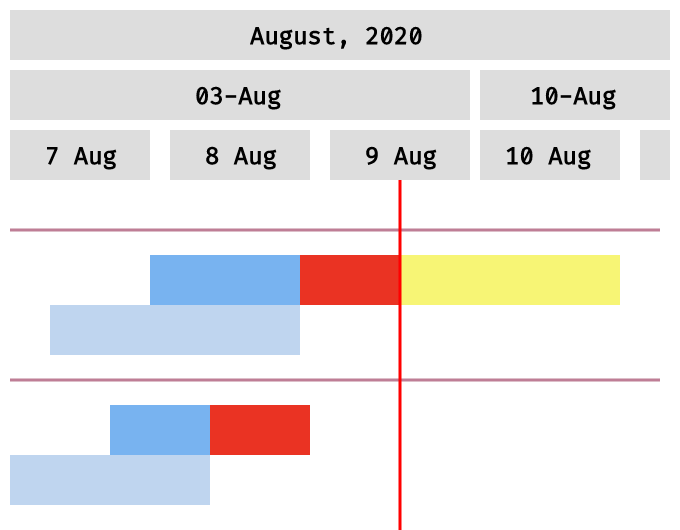
Baseline-Dependent Coloring of Actual Bars
The actual bars can now be automatically colored depending on the current status compared to the baseline plan. It will let you view the variances between the present and original schedules at a glance.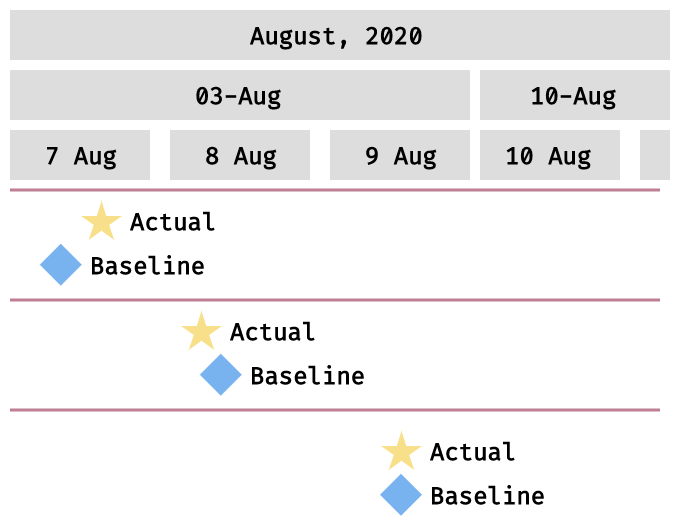
Baseline Milestones
Now you can put milestones on not only actual but also baseline elements. So you will be able to schedule important events and evaluate progress through the respective milestones with ease.Improvements:
- QLIK-363 — Milestones preview centered in a row.
- QLIK-454 — Baseline bars can be shown above actual bars.
- QLIK-455 — Collapse/expand buttons are configurable now.
- QLIK-458 — Dimension column rows HTML support.
- QLIK-459 — Performance improvements.
Bug fixes:
- QLIK-460 — AnyGantt conversion issue fixed.
- QLIK-515 — AnyGantt sorting issues fixes.
- QLIK-656 — AnyGantt Resource labels issues fixed.
AnyGantt Qlik Extensions version 4.5.254
Released Jul 21, 2021Improvements:
- QLIK-361 — Unbalanced tree option added providing more flexibility with hierarchical data.
- QLIK-364 — Preview milestones can now be shown only on collapsed grouping tasks.
Bug fixes:
- QLIK-312 — Gantt milestones issue, empty tooltip issue fixed.
- QLIK-314 — Resource milestones labels issue fixed.
- QLIK-318 — Extension conversion issue fixed.
- QLIK-336 — Unnecessary custom tooltip title on table issue fixed.
- QLIK-362 — Tooltip issue fixed.
- QLIK-365 — Resource milestones elements position issue fixed
- QLIK-366 — Show total with fully expanded mode issue fixed
- QLIK-416 — Gantt legend control issue fixed
- QLIK-419 — Gantt redraw issue when filter pane in fullscreen mode fixed
AnyGantt Qlik Extensions version 4.4.253
Released Mar 3, 2021
Legend
The legend is now available for Gantt charts, add any number of colored markers to explain color coding on a chart and make it easier to read.
Total Row in Table Grid
Now it is possible to turn totals in the table on and off and format them.Bug fixes:
- QLIK-341 — Export image/pdf issues are fixed
- QLIK-338 — Table generating empty columns issue fixed
AnyGantt Qlik Extensions version 4.3.251
Released Dec 17, 2020Improvements:
- QLIK-288 — Added an option to collapse table while doing Full load at the same time
Bug fixes:
- QLIK-302 — Fixed incorrect selection behaviour
- QLIK-268 — Fixed incorrect property panel namings
AnyGantt Qlik Extensions version 4.3.249
Released Sep 16, 2020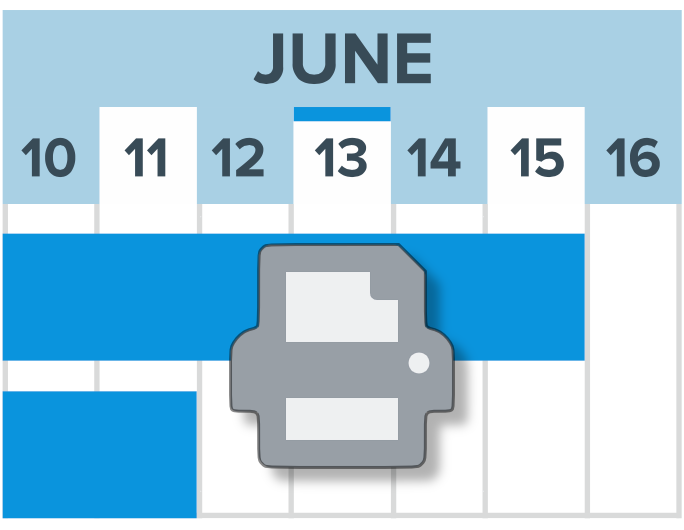
Visible Dates Printing
Now you can choose to print only the part of a Gantt chart displayed at the moment.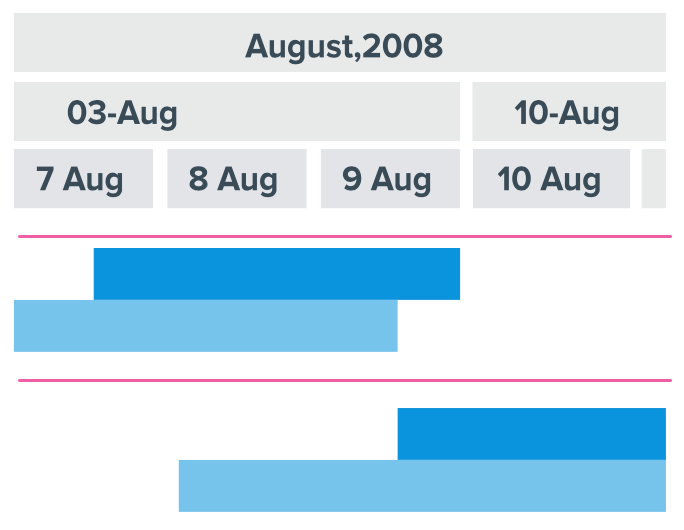
Grid stroke settings
Horizontal grid lines are now configurable.Improvements:
- QLIK-211 — Gantt gaps in pixels: Now you can set left and right gaps on the chart in pixels, assigning just the right amount of space for item labels.
Bug fixes:
- QLIK-53 — Tooltip settings issues fixed.
- QLIK-220 — Incorrect behavior with "Include null values" fixed.
- QLIK-253 — Font color by expression issue fixed.
AnyGantt Qlik Extensions version 4.2.248
Released July 15, 2020
Weekends and Holidays Coloring
Added an option to change how weekends and holidays are colored on the timeline.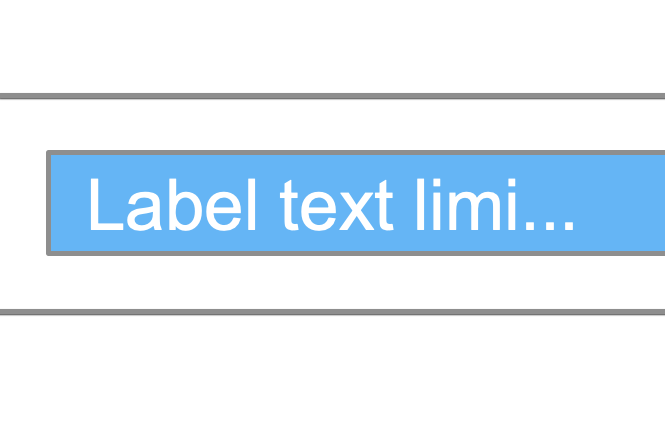
Labels Text Length
Added an option to limit the number of characters in labels for easier control over the chart display.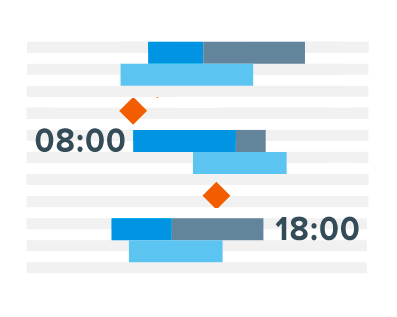
Left and Right Gaps
Added an option to add left and right gaps on the timeline for better display and print output.Improvements:
- QLIK-159 — Measures Mappings Improvement.
Bug fixes:
- QLIK-61 — Zoom feature now works in a correct manner when the table is hidden.
- QLIK-165 — Qlik Desktop minor issues with charts have been addressed.
- QLIK-186 — Minor chart conversion issues have been addressed.
- QLIK-190 — Weekday names issue has been fixed.
AnyGantt Qlik Extensions version 4.1.247
Released June 10, 2020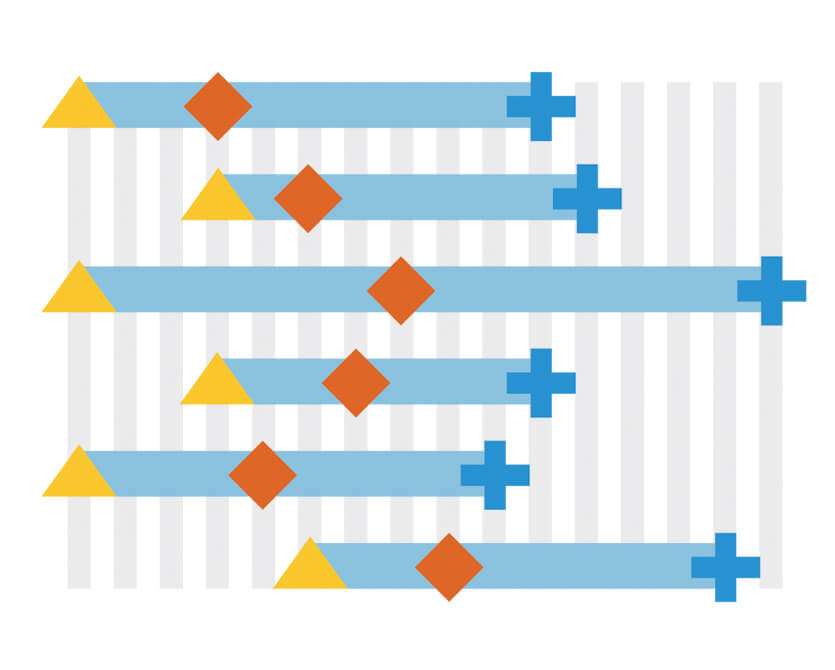
QLIK-142 — Multiple Milestones
You can now display Milestones on the Resource Gantt Chart, this provides you with an option to show multiple milestones with individual tooltips in one line.
QLIK-99 — Text Shadow
Most of the text elements got an option to tune the shadow of the text when configuring font settings. Shadow effect can help with text display on certain background colors or give your visualizations more wow-effect.Improvements:
- QLIK-63 — Labels format improvements.
Bug fixes:
- QLIK-160 — Incorrect tooltip issue on Resource chart fixed.
- QLIK-164 — Embedding issue on Qlik Cloud Edition fixed.
- QLIK-85 — Chart conversion issues fixed.
- QLIK-156 — Export issues fixed.
AnyGantt Qlik Extensions version 4.1.244
Released Apr 23, 2020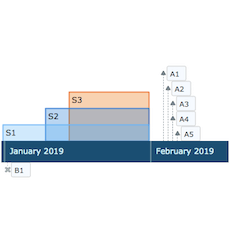
Timeline Chart
A timeline chart is a visualization of events in chronological order. It displays both events occupying periods of time (ranges) and events with zero duration (moments). Events and dates are shown on a long horizontal bar (axis).
QLIK-62 — Coloring/Palettes support
Every element in Gantt, Resource and Timeline charts now has an option to be colored according to a predefined set of palettes (schemes). There are a lot of options, including coloring by the level of depth in hierarchy and more.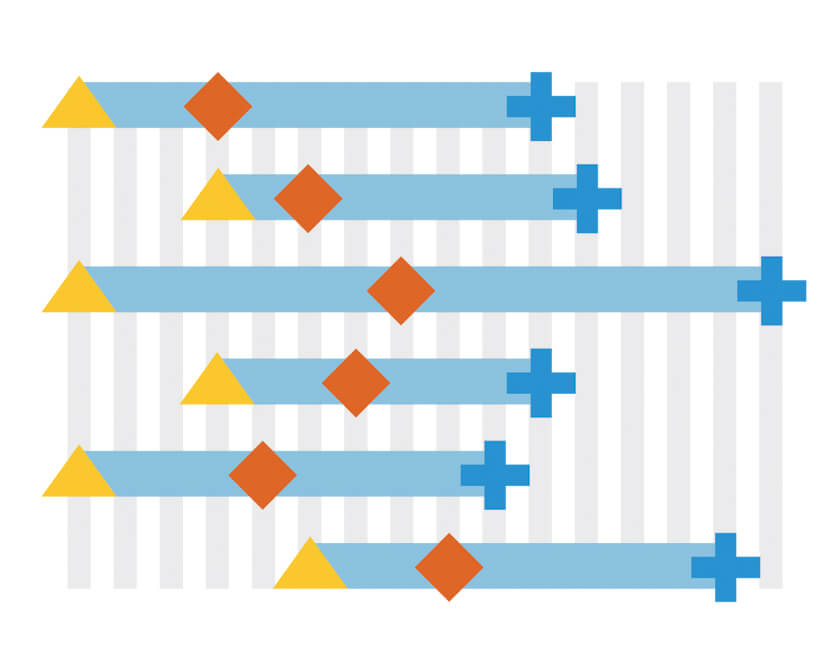
QLIK-122 — Start/End Markers
Now it is possible to add start and end markers of the elements to make tasks and periods easier to read on the timeline. Progress bars also have start and end markers, this makes this mechanism even more flexible and amazing.
QLIK-65 — Zoom on the mouse wheel
We have added an option to choose if you want to scroll or zoom when the mouse wheel is used on the chart. This is a part of extended Interactivity settings.
QLIK-102 — Rows height settings
It is now possible to set the height of rows in Gantt and Resource charts to make them either more compact when you have a lot of data or more readable if that's what you want to see on the chart.
QLIK-134 — Disabling table
Resource and Gantt charts now have an option to remove the table part and leave only elements along with the timeline to be displayed.Improvements:
- QLIK-59 — Presets for background corners settings for easier background configuration.
- QLIK-64 — Toolbar icons and text size settings for extra tuning of how toolbar looks like.
- QLIK-101 — Print Paper Size settings added. You can now choose which formats appear in the print dropdown in the toolbar.
- QLIK-130 — Fiscal year settings improved.
Bug fixes:
- QLIK-54 — Label background settings issues fixed.
- QLIK-87 — Multipage printing issues fixed.
- QLIK-96 — Labels align/offsets issues fixed.
- QLIK-118 — Dimension bars baseline issues fixed.
AnyGantt Qlik Extensions version 4.0.241
Released Feb 14, 2020
QLIK-60 — Disabling Interactivity
Now it is possible to disable interactive features: tooltips, snapshots, and selection.
QLIK-57 — Disabling Dimension Bars / Progress
Now it is possible to disable dimension bars and progress bars attached to them.
QLIK-43 — Milestones Settings
Using images for milestones, as well as applying other settings, is now much easier.Improvements:
- QLIK-50 — Added the alignment and offset settings of labels attached to dimension bars.
- QLIK-44 — Settings in the properties panel are now grouped to improve user experience.
- QLIK-42 — Improved the About tab in the properties panel.
- QLIK-36 — Added the ability to set the type of connectors.
Bug fixes:
- QLIK-67 — Fixed an issue with the font family in tooltips.
- QLIK-49 — Fixed a bug affecting the table font in measure columns.
- QLIK-48 — Fixed issues with fonts display.
- QLIK-47 — Fixed a zero-stroke issue.
- QLIK-46 — Fixed a hierarchy fill issue.
- QLIK-45 — Fixed issues with settings of dimension bars.
- QLIK-33 — Fixed an issue with disappearing milestones.
AnyGantt Qlik Extensions version 4.0.240
Released Dec 18, 2019
ENV-1410 — Performance improvement
Now you can decide if you want to load data in "Fully expand" mode or not. When the data is not expanded it loads much faster providing a better user experience.
ENV-1363 — Timeline Zoom Levels Configuration Interface
We've developed an amazing interface to configure the timeline zoom levels. Now you can choose which time units can be seen in your timeline and change it easily at any time.Bug fixes:
- ENV-1454 — Tooltips can now be properly set in resource charts.
- QLIK-20 — Empty chart doesn't flicker when the initial display happens.
- ENV-1405 — Various chart repaint issues fixed making the display much more stable.
AnyGantt Qlik Extensions version 4.0
Released Nov 01, 2019
Cascade Coloring of Rows
In the 4.0 release, we've introduced two pre-built coloring patterns for rows. One of them is cascade, which implies that each next nesting level is colored lighter than the previous one while staying within the same hue. This is designed to streamline the visual perception of nesting.
Odd-Even Coloring of Rows
The other row coloring pattern delivered in version 4.0 of the AnyGantt extension can be applied to get odd and even rows colored differently. This style is expected to help data analysts better recognize which row one Gantt chart element or another belongs to.
Expanded/Collapsed by Default
We've further extended the default state settings. In particular, you can easily make a Gantt chart appear collapsed down to the top nesting level, facilitating the initial general overview of the project progress or resource allocation.
Connectors
Now it is possible to show dependencies between tasks in a project by means of showing connectors that link one activity to another.
Export, NPrinting, and Snapshots
Meet the full-fledged support of exporting to PNG, PDF, and NPrinting as it is already added to our AnyGantt extension for Qlik Sense! Snapshots properly show the state of the Gantt chart: zoomed in/out, expanded/collapsed, etc.
Calculation Condition
You can now specify an expression in a text field to set a condition that needs to be fulfilled (true) for the object to be displayed. The value may be entered as a calculated formula. For example: count(distinct Team)<3. If the condition is not fulfilled, the message or expression entered in Displayed message is displayed.A calculation condition is useful when a chart or table is very big and makes the visualization slow to respond. A calculation condition can then help so that for example an object does not show until the user has filtered the data to a more manageable level by applying selections.

Showing Measures as Columns in Resource Chart
In the new version, we've also provided Resource Charts with the capability to visualize measures as columns on the data grid - like in Project Charts. This allows additional information about the elements of a Resource Gantt Chart diagram to be neatly displayed.
Table Header Settings
Table headers can now be stylized to the full extent. In particular, it is possible to customize the background color, font, as well as the text.
Row Numbering
Now you can apply a numbering scheme to the rows in your Gantt Chart. There are currently three options available out of the box:- single-level, i.e. consecutive numbering - when all elements are numbered one by one in regular ascending order, e.g. 1, 2, 3, and so on;
- multi-level, i.e. hierarchical numbering - when top-level elements are numbered 1, 2, 3, and so on, second-level elements are numbered 1.1, 1.2, 1.3, 1.4, and so on, etc.;
- custom - to be determined using a function.

Label Position Settings
Last but not least, we've brought a set of UI controls to facilitate arranging a desired position for labels within or beyond task bars:- inside a bar - alignment to the left, center, or right;
- outside - sticking to the bars' left or right sides.
