
Возможности ресурсной диаграммы "Ганта"
Ресурсные диаграммы помогают оптимизировать распределение ресурсов. Изучите все ключевые возможности "Ресурсной диаграммы Ганта" в Qlik Sense в этом демо.
Возможности ресурсной диаграммы "Ганта"


Об этом приложении
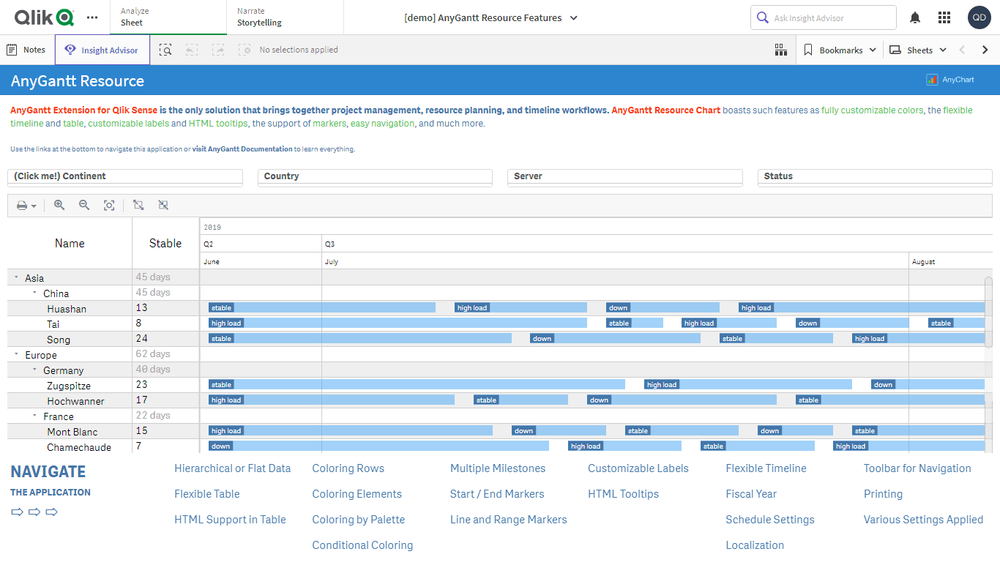
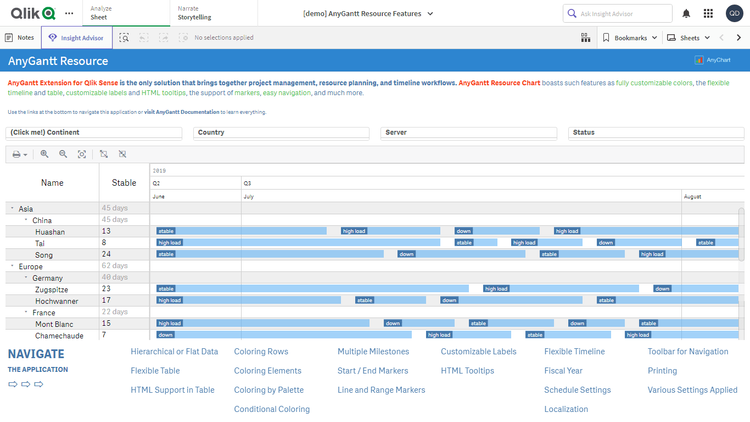
“Ресурсные диаграммы Ганта” позволяют эффективно управлять распределением ресурсов. На примере этой визуализации (вымышленных) данных об использовании ресурсов изучите все ключевые возможности нашего интуитивного расширения “Ресурсная диаграмма Ганта” для Qlik Sense. Смотрите различные структуры данных, гибкие таблицы и временные шкалы, настраиваемые вехи, подписи, маркеры, окрашивание, параметры финансового года и многое другое в действии.
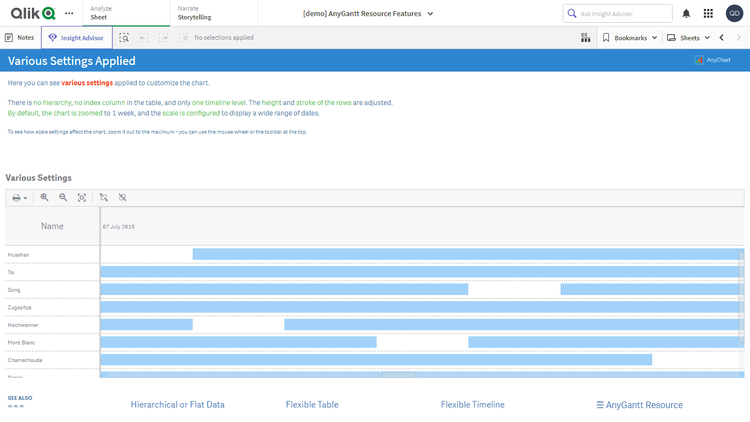
Это приложение демонстрирует ресурсную диаграмму "Ганта", созданную с помощью расширения AnyGantt для Qlik Sense. Набор данных является вымышленным.