
Разрешения на передвижные точки питания
Это демо для Qlik использует ресурсную диаграмму для отображения этапов работы. Наслаждайтесь продвинутой визуальной аналитикой в Qlik с расширениями AnyChart.
Разрешения на передвижные точки питания
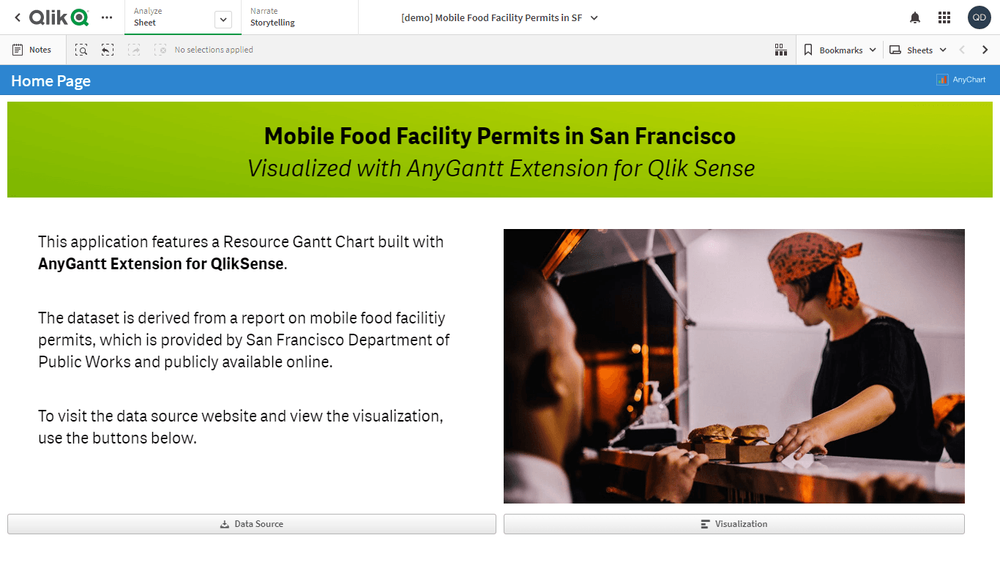


Об этом приложении
Просмотрите разрешения на передвижные точки питания в Сан-Франциско в наглядной визуализации официальных данных, предоставленных Департаментом общественных работ города. Для каждого оператора и локации быстро определяйте текущий статус разрешения (одобрено, истекло, неактивно, выдано, запрошено или приостановлено), а также даты получения и одобрения заявки и дату окончания действия разрешения.
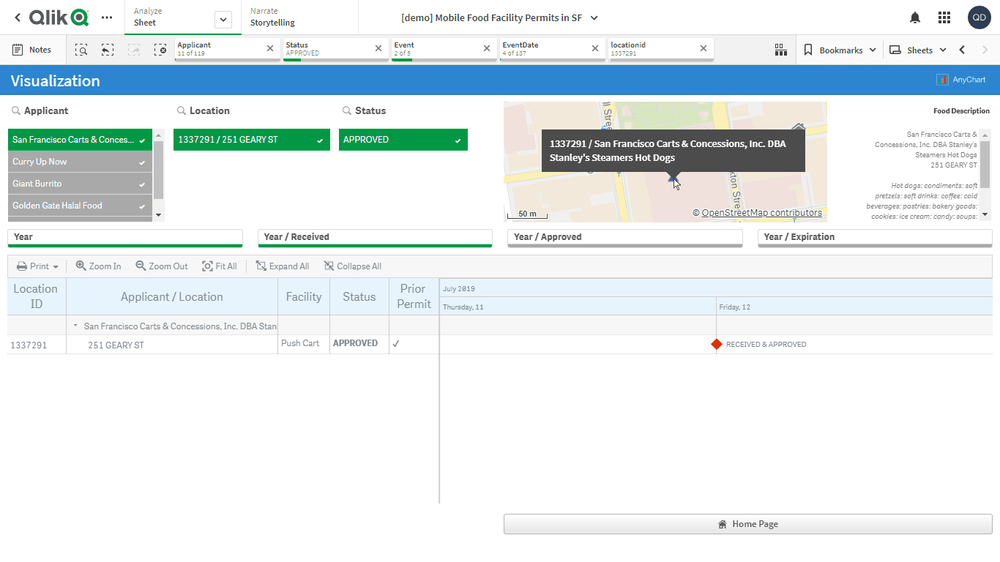
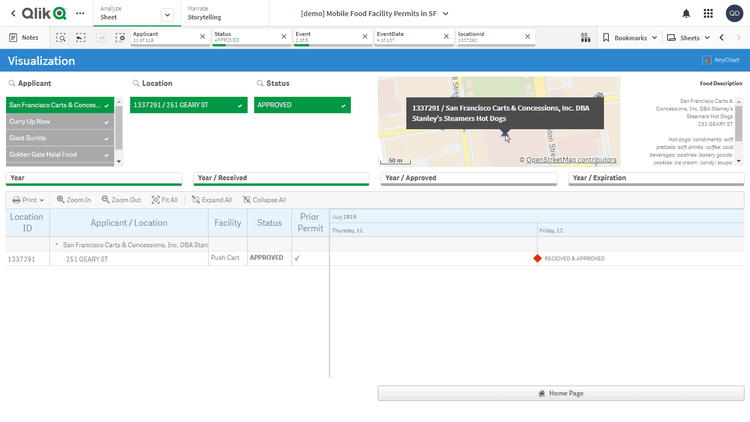
Это приложение включает Ресурсную диаграмму Ганта, созданную с помощью расширения AnyGantt для Qlik Sense. Набор данных основан на публичном отчёте о разрешениях на мобильные точки питания, предоставленном Департаментом общественных работ Сан-Франциско.
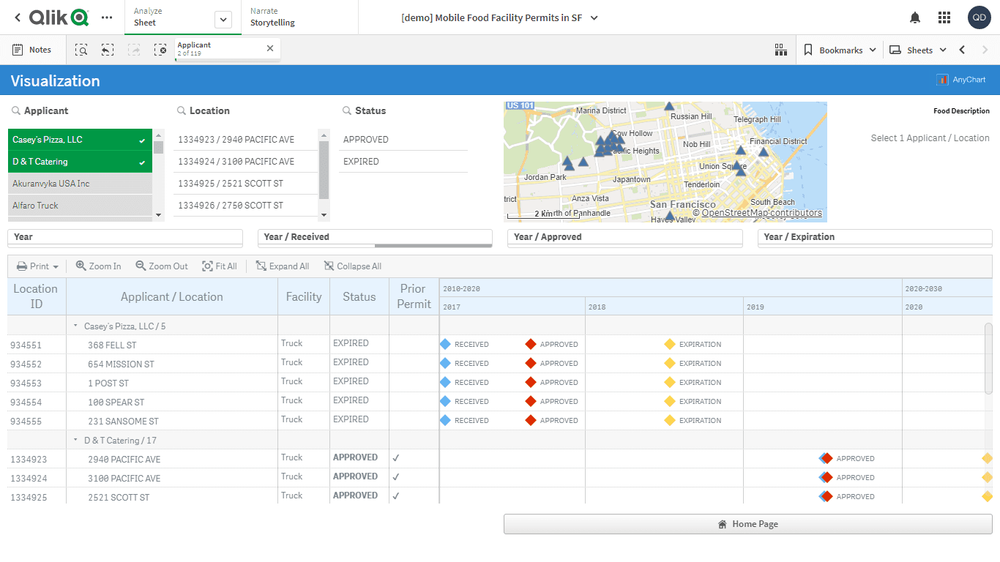
Ресурсная диаграмма Ганта:
- Диаграмма содержит 3 измерения. Иерархия:
- Applicant (заявитель/оператор)
- Location (адрес)
- Event (событие, связанное с заявкой)
- В таблице есть 3 дополнительных столбца: Facility (Truck или Push Cart), Status (Requested, Approved, Expired и т. п.) и Prior Permit (отмечается, если ранее разрешение было получено).
- Индексный столбец отображает ID локаций с помощью пользовательского выражения.
- Столбец Status использует HTML-форматирование для выделения одобренных заявок.
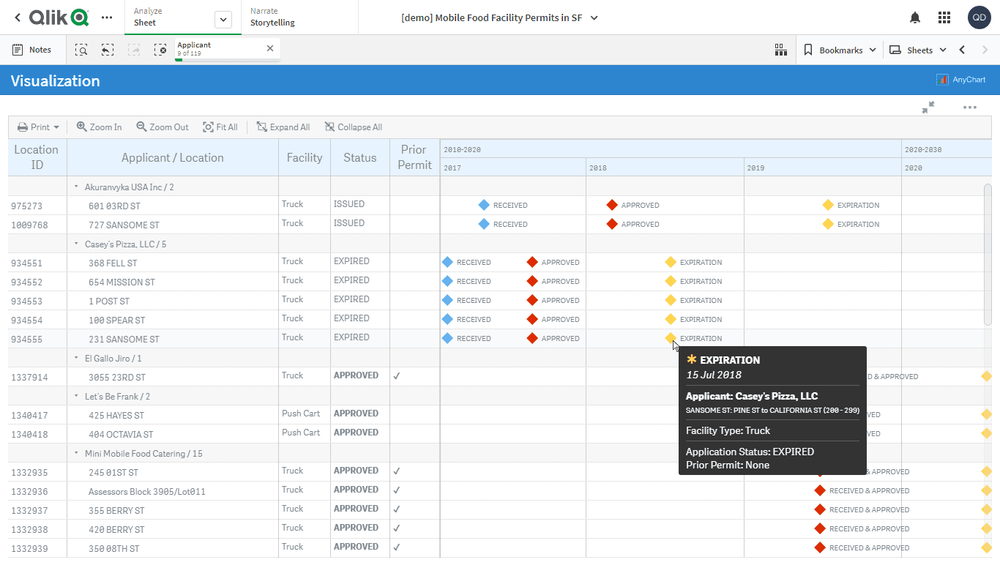
- В Ресурсной диаграме Ганта от AnyChart для Qlik Sense можно показывать несколько вех в одной строке. Эта возможность используется в приложении, чтобы все события, относящиеся к одной локации, отображались в соответствующей строке.
- Вехи (события) окрашиваются по выражению для удобного различения их типов.
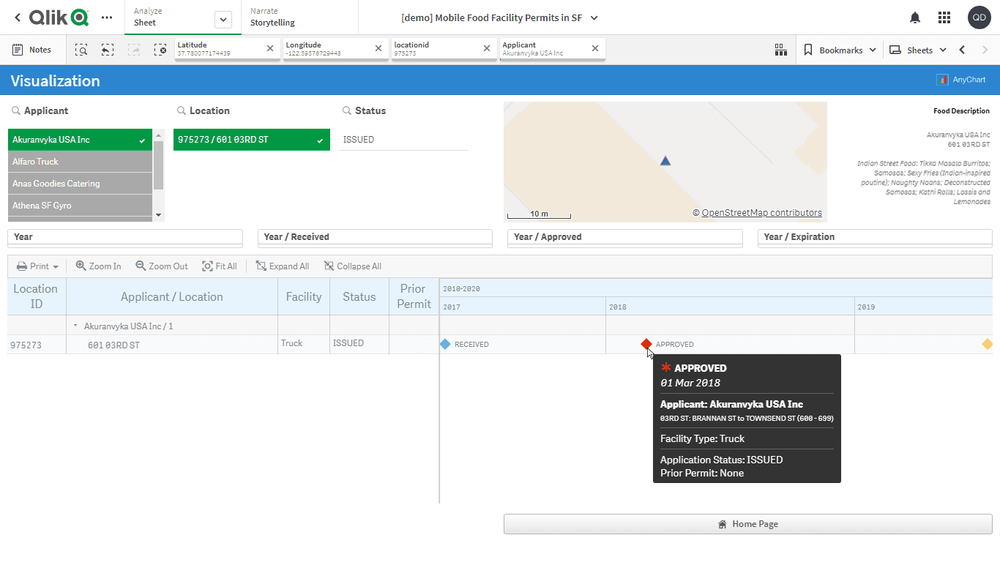
- Всплывающие подсказки оформлены с помощью HTML и содержат дополнительную информацию: описание локации, тип точки (Facility), статус заявки и наличие предыдущего разрешения. Заголовок подсказки включает HTML-иконку, цвет которой соответствует типу события.
- Уровни временной шкалы настроены.
Дополнительно:
- Фильтрация по заявителю, локации и статусу.
- Данные содержат координаты локаций, они отображаются на карте (родная визуализация Qlik Sense).
- Рядом с картой размещена стандартная визуализация Qlik Sense «Текст и изображение», показывающая описание кухни/блюд для выбранной точки.