
Bullseye Chart
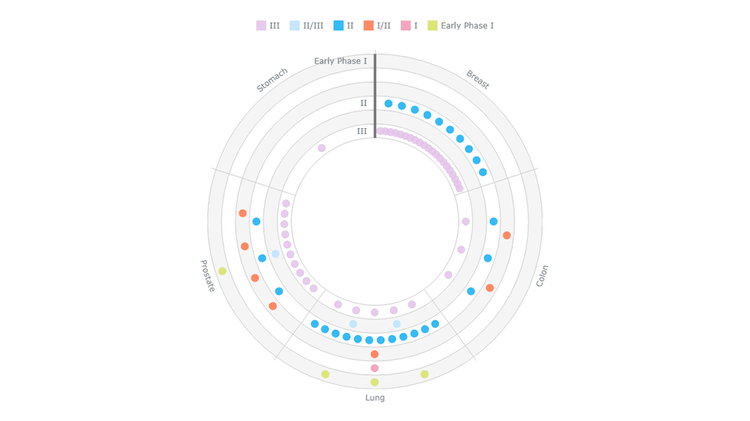
Active Clinical Trials (RPCI)
Grab a clear picture of the active clinical research studies conducted at Roswell Park Cancer Institute and how they progress. For each of the five most common types of cancer by primary anatomic site of origin, learn what trials are ongoing and intuitively understand which ones are closer to completion than others. Explore by cancer type, current phase, protocol, principal investigator, or start year.
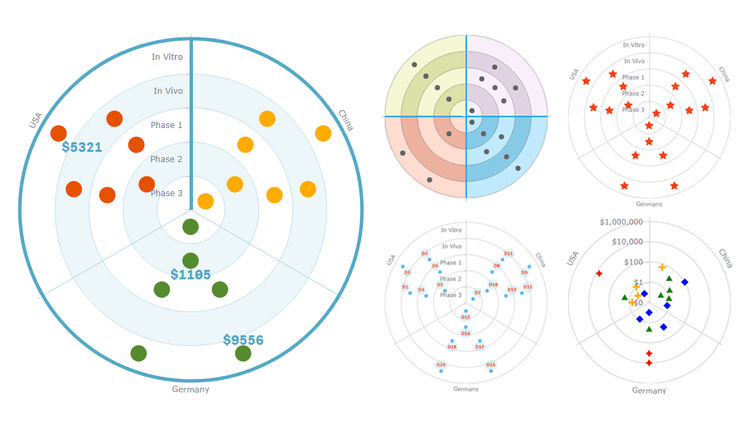
Bullseye Chart Features
Bullseye charts are widely used to visualize product pipelines in a clear and concise way. Explore all major features of our intuitive Bullseye Chart Extension for Qlik Sense as you look at a fictional drug pipeline that graphically represents how clinical trials progress through phases. See flexible axes and grids, customizable labels and markers, conditional coloring, HTML tooltips, and much more demonstrated in action.
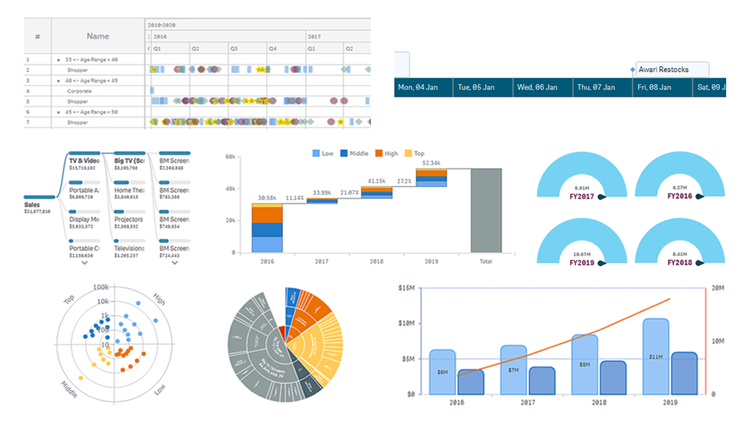
AnyChart Complex Demo
Named best in data analytics and visualization in 2023, AnyChart offers a set of innovative Qlik Sense extensions. Discover the power of the major ones in a quick demo overview and see how they can help you take your visual analytics in Qlik to the next level: Decomposition Tree, Gantt Chart, Combo Chart, Circular Gauge, Bullseye Chart, Sunburst Chart, Timeline Chart, and Waterfall & Advanced Waterfall Chart.