
Funciones del Gráfico de Línea de Tiempo
Los gráficos de línea de tiempo permiten explorar eventos en orden cronológico. Descubre las funciones principales del Gráfico de Línea de Tiempo en Qlik Sense.
Funciones del Gráfico de Línea de Tiempo


Acerca de esta aplicación
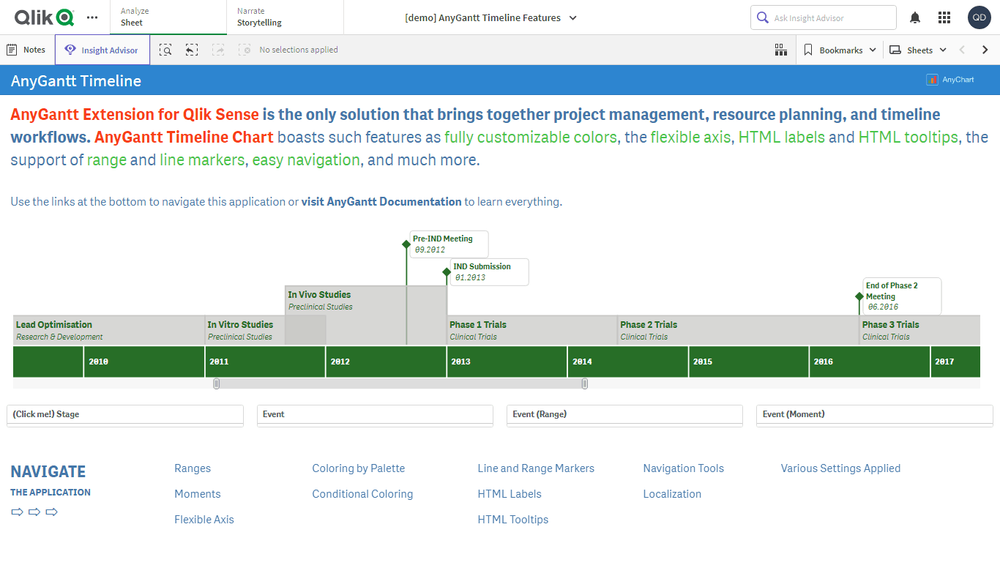
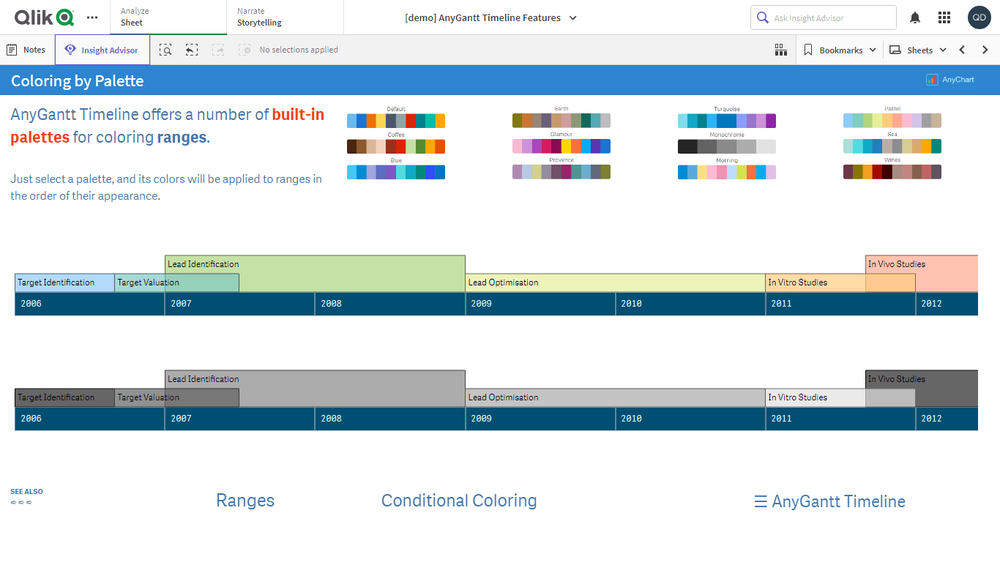
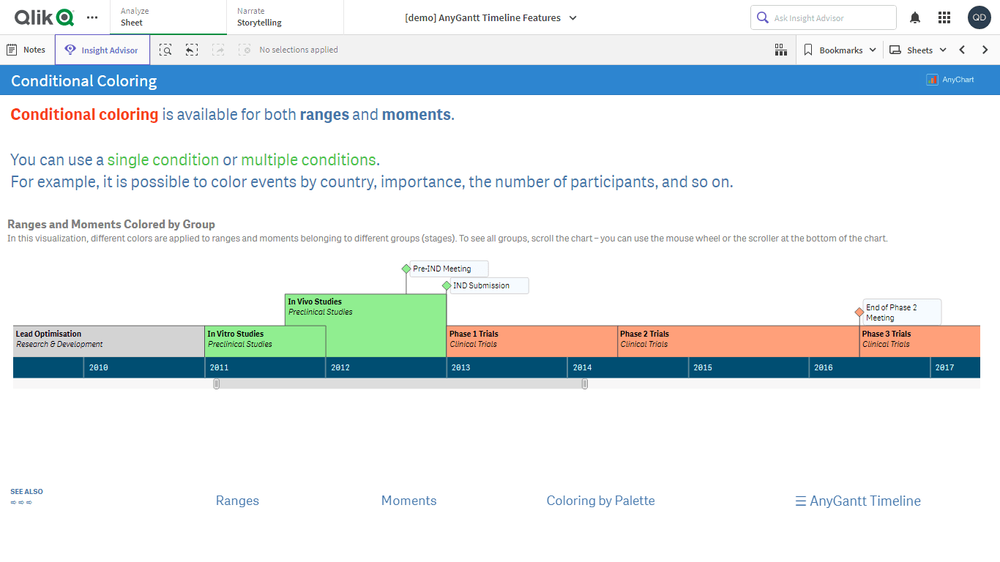
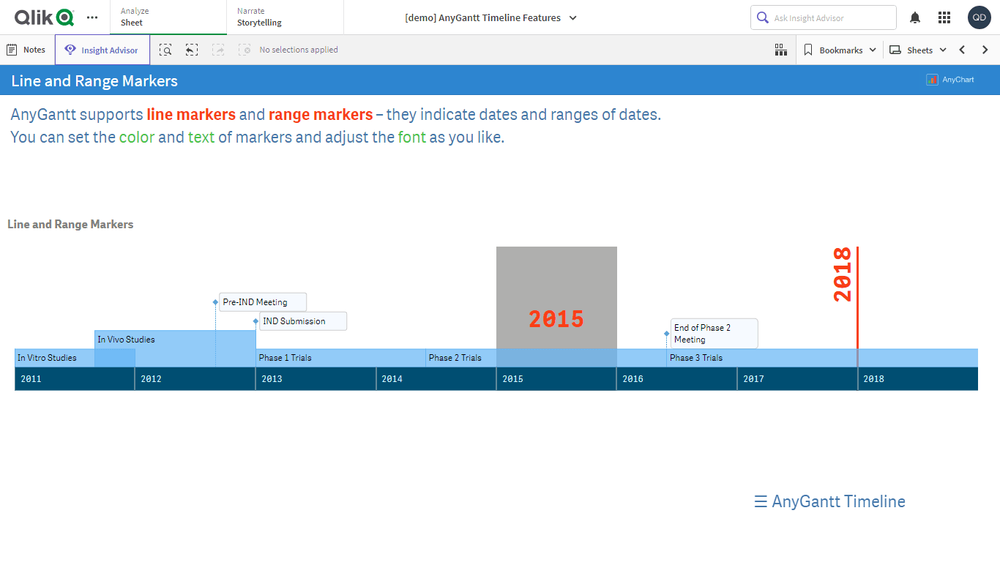
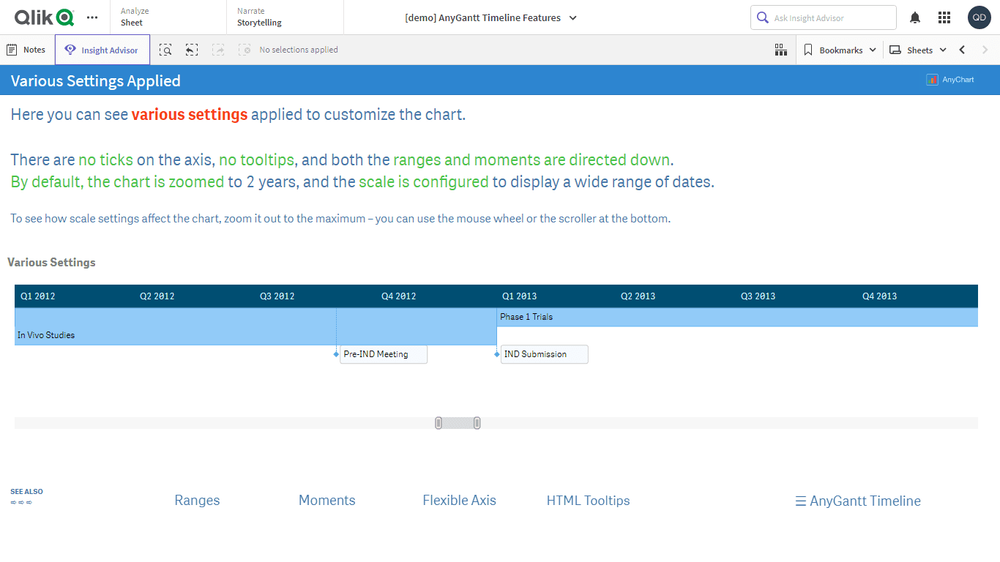
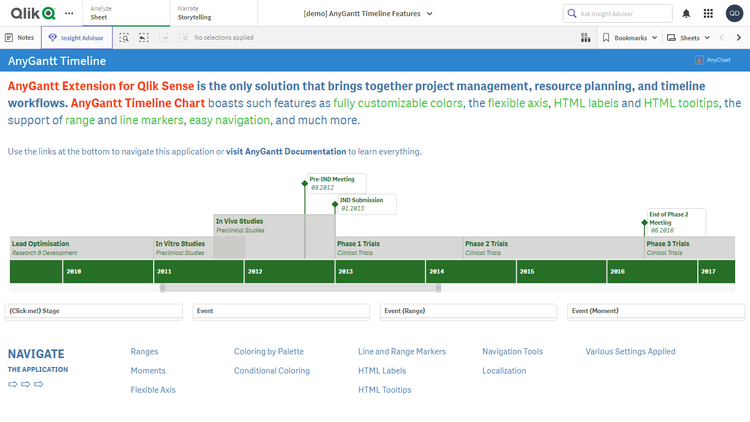
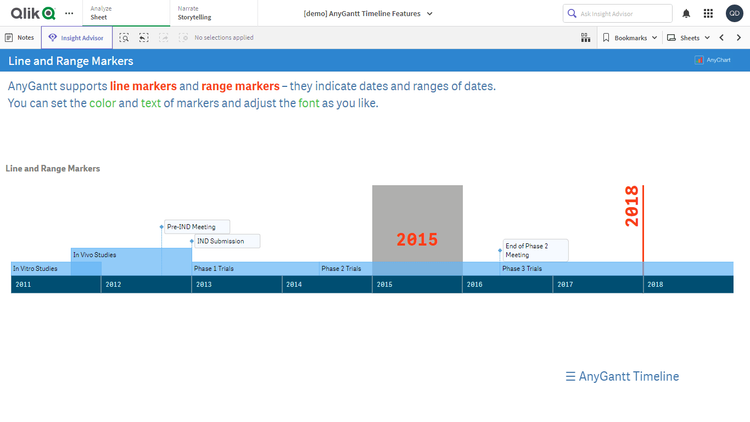
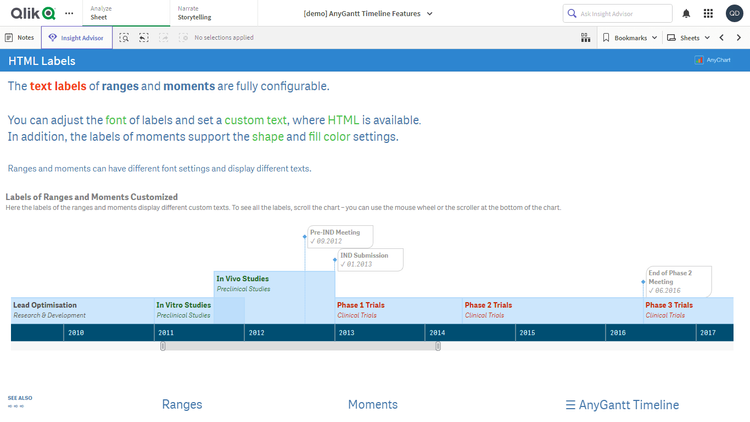
Los gráficos de línea de tiempo ofrecen una visión clara de una serie de eventos en orden cronológico. Explora todas las funciones principales de nuestra intuitiva Extensión de Gráfico de Línea de Tiempo para Qlik Sense mientras observas una visualización ficticia de un proceso de desarrollo de medicamentos. Descubre múltiples opciones para personalizar rangos y momentos, establecer marcadores y etiquetas, configurar ejes, navegación, tooltips y mucho más en acción.
Esta aplicación presenta un Gráfico de Línea de Tiempo creado con la extensión AnyGantt para Qlik Sense. El conjunto de datos es ficticio.