
Waterfall Chart Features
Explore all major features of our Waterfall Chart Extension for Qlik Sense in this Qlik demo app: different data modes, stacked subcategories, and more.
Waterfall Chart Features


About this app
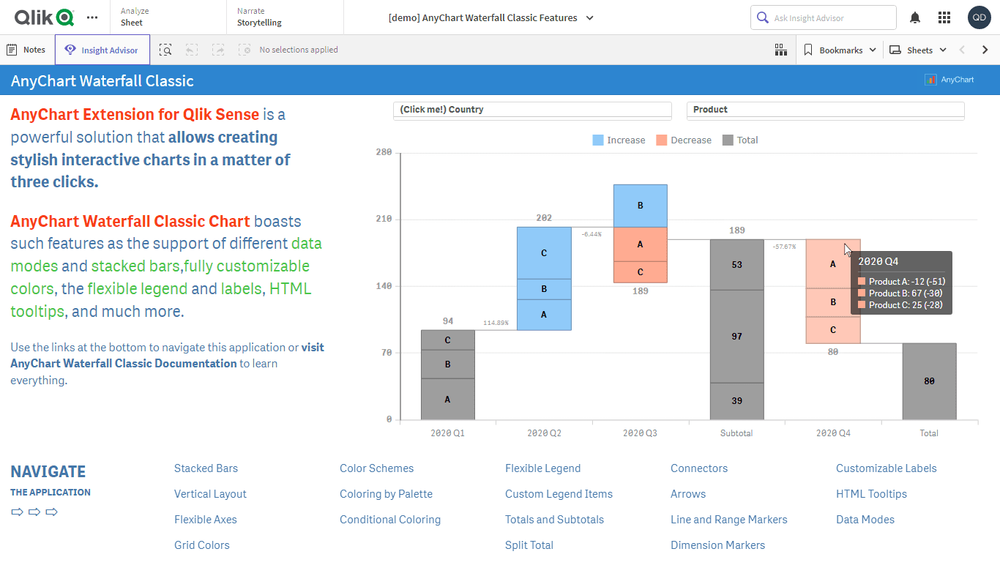
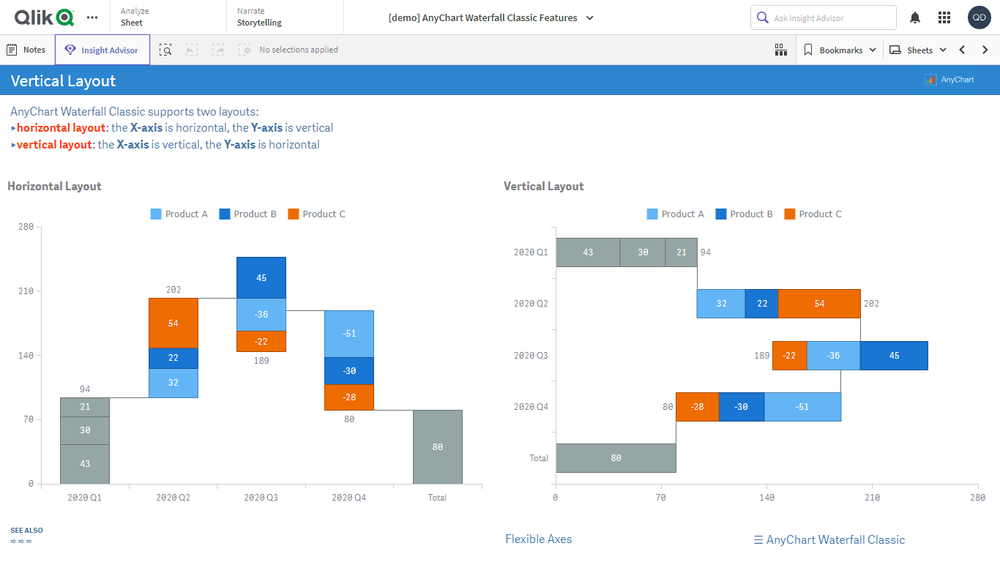
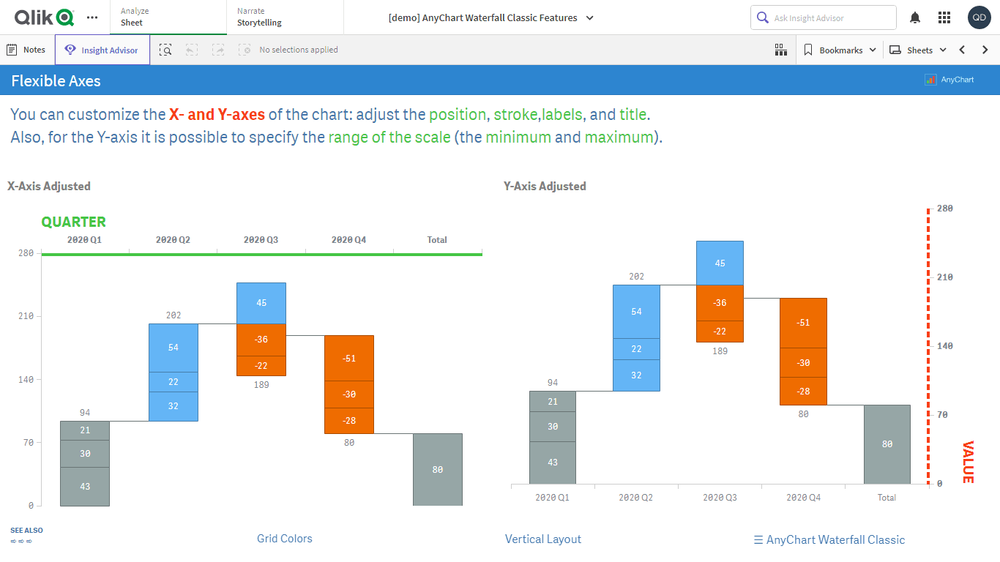
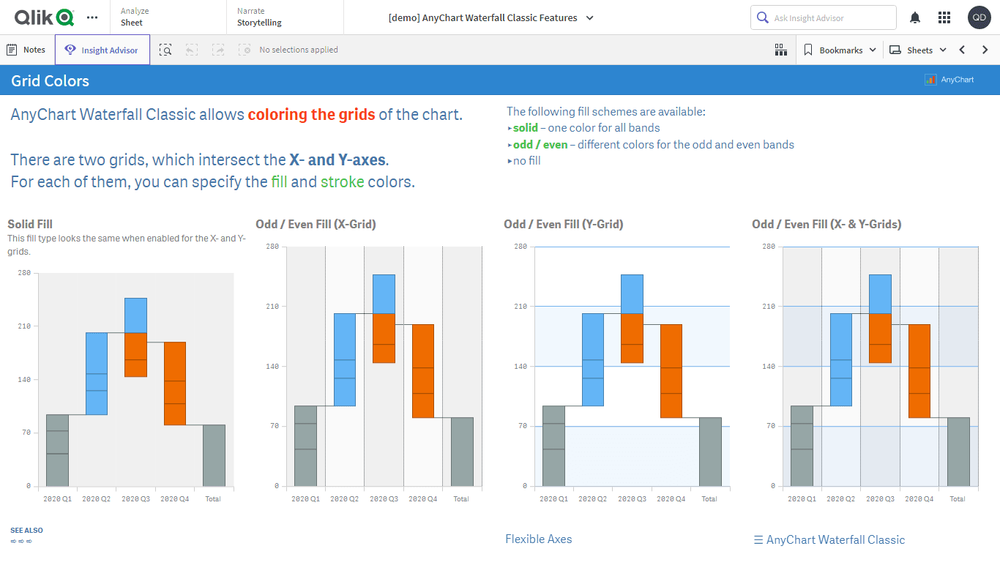
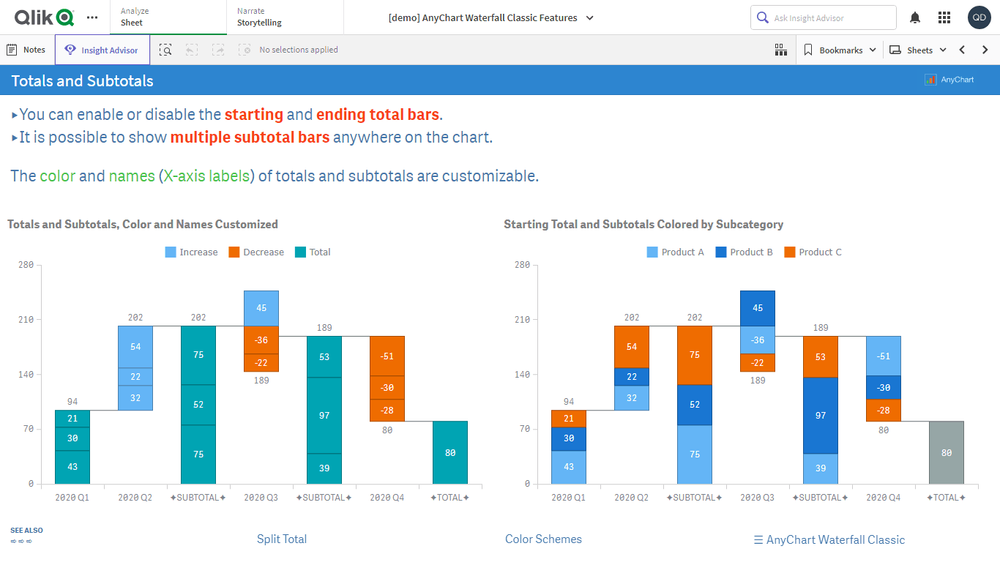
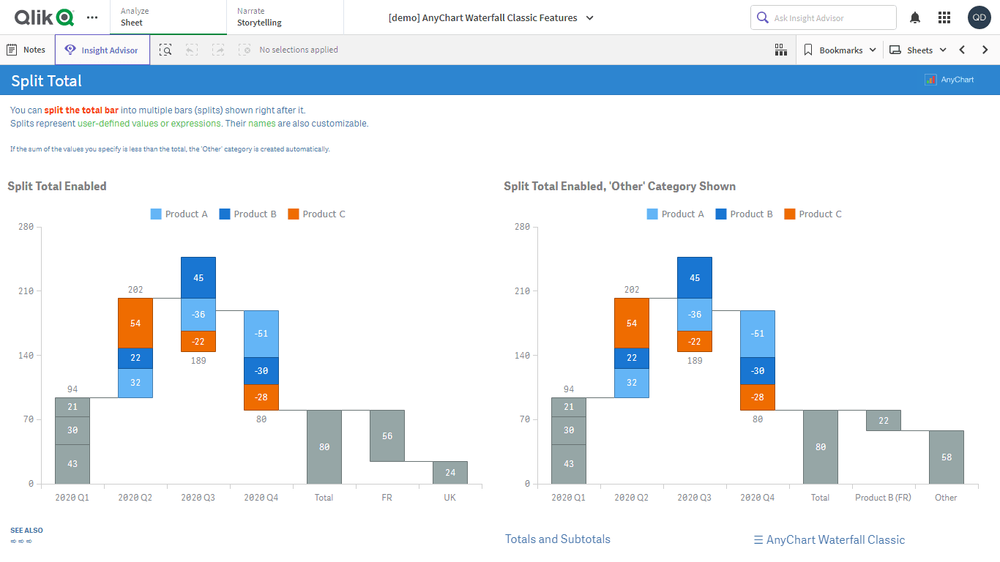
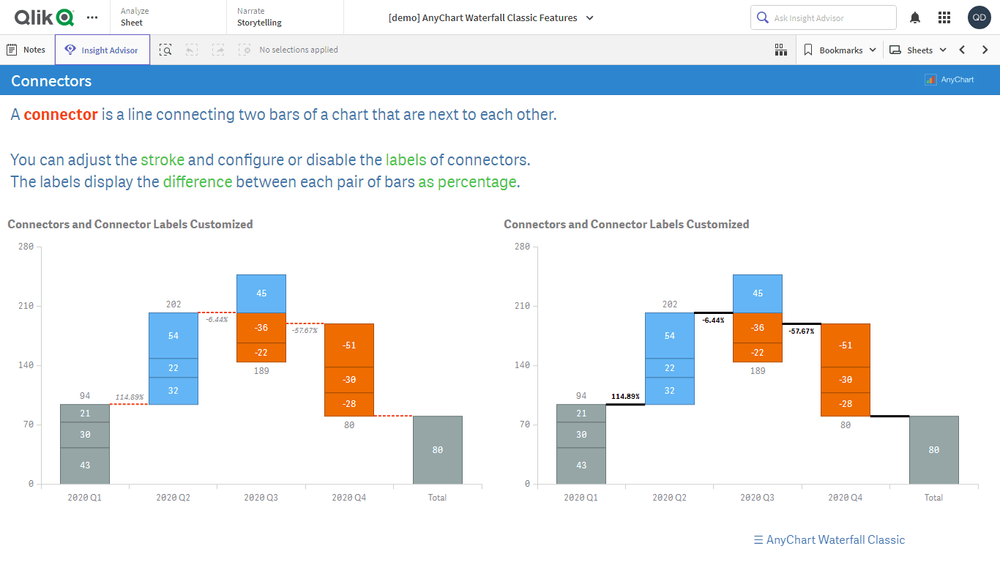
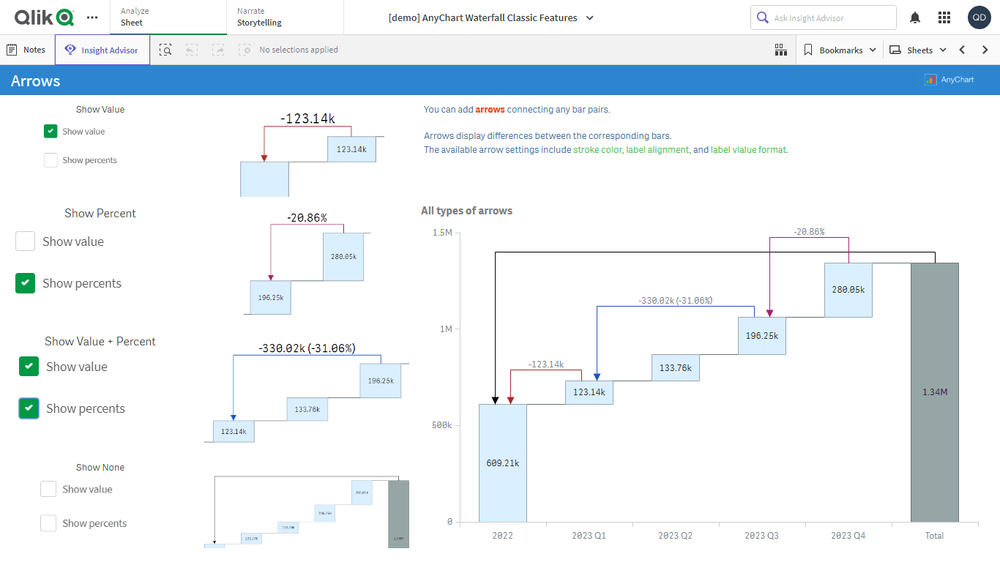
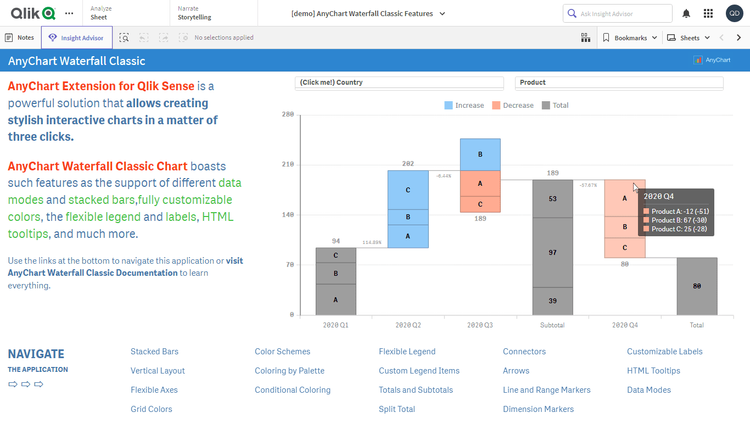
Waterfall charts reveal the cumulative effect of sequentially added and subtracted values. Looking at a fictional product metrics visualization — explore all major features of our intuitive Classic Waterfall Chart Extension for Qlik Sense, which supports a wider range of options than Qlik's default solution. See different data modes, stacked subcategories, customizable coloring, flexible axes, and much more demonstrated in action.
This application features a Classic Waterfall Chart visualization built with the Waterfall Classic extension for Qlik Sense. The dataset is fictional.